'%3e%3cpath%20d='M19.026%2018.7732C17.429%2020.0902%2015.832%2020.8802%2013.57%2020.8802C9.71101%2020.8802%206.783%2017.7202%206.783%2013.6392V13.5072C6.783%209.42616%209.71101%206.26616%2013.57%206.26616C15.566%206.26616%2017.163%206.92416%2019.026%208.50416C20.091%206.92416%2021.555%205.60716%2023.418%204.81716L23.284%204.68616C20.623%202.05316%2017.562%200.868164%2013.57%200.868164C6.25101%200.868164%200.662003%206.26616%200.662003%2013.5082V13.6382C0.662003%2017.0622%201.993%2020.2222%204.255%2022.5922C6.65%2024.9622%209.844%2026.2782%2013.304%2026.2782C17.429%2026.2782%2020.224%2025.0932%2023.018%2022.3282C21.421%2021.4072%2019.958%2020.2222%2019.026%2018.7732ZM40.318%201.00016C36.458%201.00016%2033.132%202.44816%2030.736%204.95016C32.599%205.74016%2034.063%207.05616%2035.128%208.63616C36.325%207.32016%2038.188%206.39816%2040.318%206.39816C44.31%206.39816%2047.37%209.55816%2047.37%2013.6392V13.7712C47.37%2017.8522%2044.31%2020.8812%2040.451%2020.8812C38.321%2020.8812%2036.591%2020.0912%2035.261%2018.6422C34.196%2020.3542%2032.599%2021.6712%2030.736%2022.3292C33.132%2024.6992%2036.458%2026.1472%2040.318%2026.1472C47.636%2026.1472%2053.492%2020.6172%2053.492%2013.5072C53.359%206.39916%2047.77%201.00016%2040.318%201.00016Z'%20fill='%23FBFCFC'/%3e%3cpath%20d='M19.559%2013.6402C19.559%209.55816%2022.885%206.26716%2027.011%206.26716C31.136%206.26716%2034.463%209.55816%2034.463%2013.6402C34.463%2017.7212%2031.136%2021.0132%2027.011%2021.0132C22.885%2021.0132%2019.559%2017.7212%2019.559%2013.6402Z'%20fill='%23FBFCFC'/%3e%3cpath%20d='M27.011%2021.0126C22.885%2021.0126%2019.559%2017.7206%2019.559%2013.6396C19.559%209.5576%2022.885%206.2666%2027.011%206.2666C27.011%206.2666%2023.817%209.8206%2023.817%2013.6396C23.817%2017.4576%2027.011%2021.0126%2027.011%2021.0126Z'%20fill='%23DCDDDE'/%3e%3c/g%3e%3cdefs%3e%3cclipPath%20id='clip0_11268_85798'%3e%3crect%20width='54'%20height='27'%20fill='white'/%3e%3c/clipPath%3e%3c/defs%3e%3c/svg%3e)
Climate change in South Carolina
Climate change is affecting locations like South Carolina in a variety of ways. In fall, these impacts include increased cooling demand, more extreme rainfall, and more intense hurricanes.
Explore these pages to learn how people in South Carolina are at risk in a warming world.
Since 1970, average annual temperatures in South Carolina have gotten 2.5°F warmer, reflecting an overall warming trend.
Warming puts people and ecosystems at risk from more frequent and intense extreme weather.
Overall, the contiguous U.S. is about 2.8°F warmer today than in 1970, based on average temperatures.
Data source: NCEI Climate at a Glance
Since 1970, South Carolina's annual precipitation has decreased by 1 inches.
Climate change is supercharging the water cycle and bringing heavier precipitation extremes across the U.S.
For every 1°F of warming, the air can hold 4% more moisture, increasing the chances of heavier downpours that contribute to flash flooding hazards.
Data source: NCEI Climate at a Glance
South Carolina's climate threats in include:
Between 1980 and 2025, South Carolina experienced 25 billion-dollar hurricanes.
As the planet warms, extreme weather events are becoming more frequent and intense, resulting in devastating losses.
Tropical cyclones (which include hurricanes and tropical storms) are the most costly extreme weather events in the U.S.
This data shows the total number of hurricanes with at least one billion dollars in damages that occurred during 1980-2025.
Data source: U.S. Billion Dollar Weather and Climate Disasters
Since 1970, average fall temperatures in South Carolina have gotten 1.7°F warmer, reflecting an overall warming trend.
Fall warming means that risky heat, fire weather, and allergies linger later into the year.
Data source: NCEI Climate at a Glance
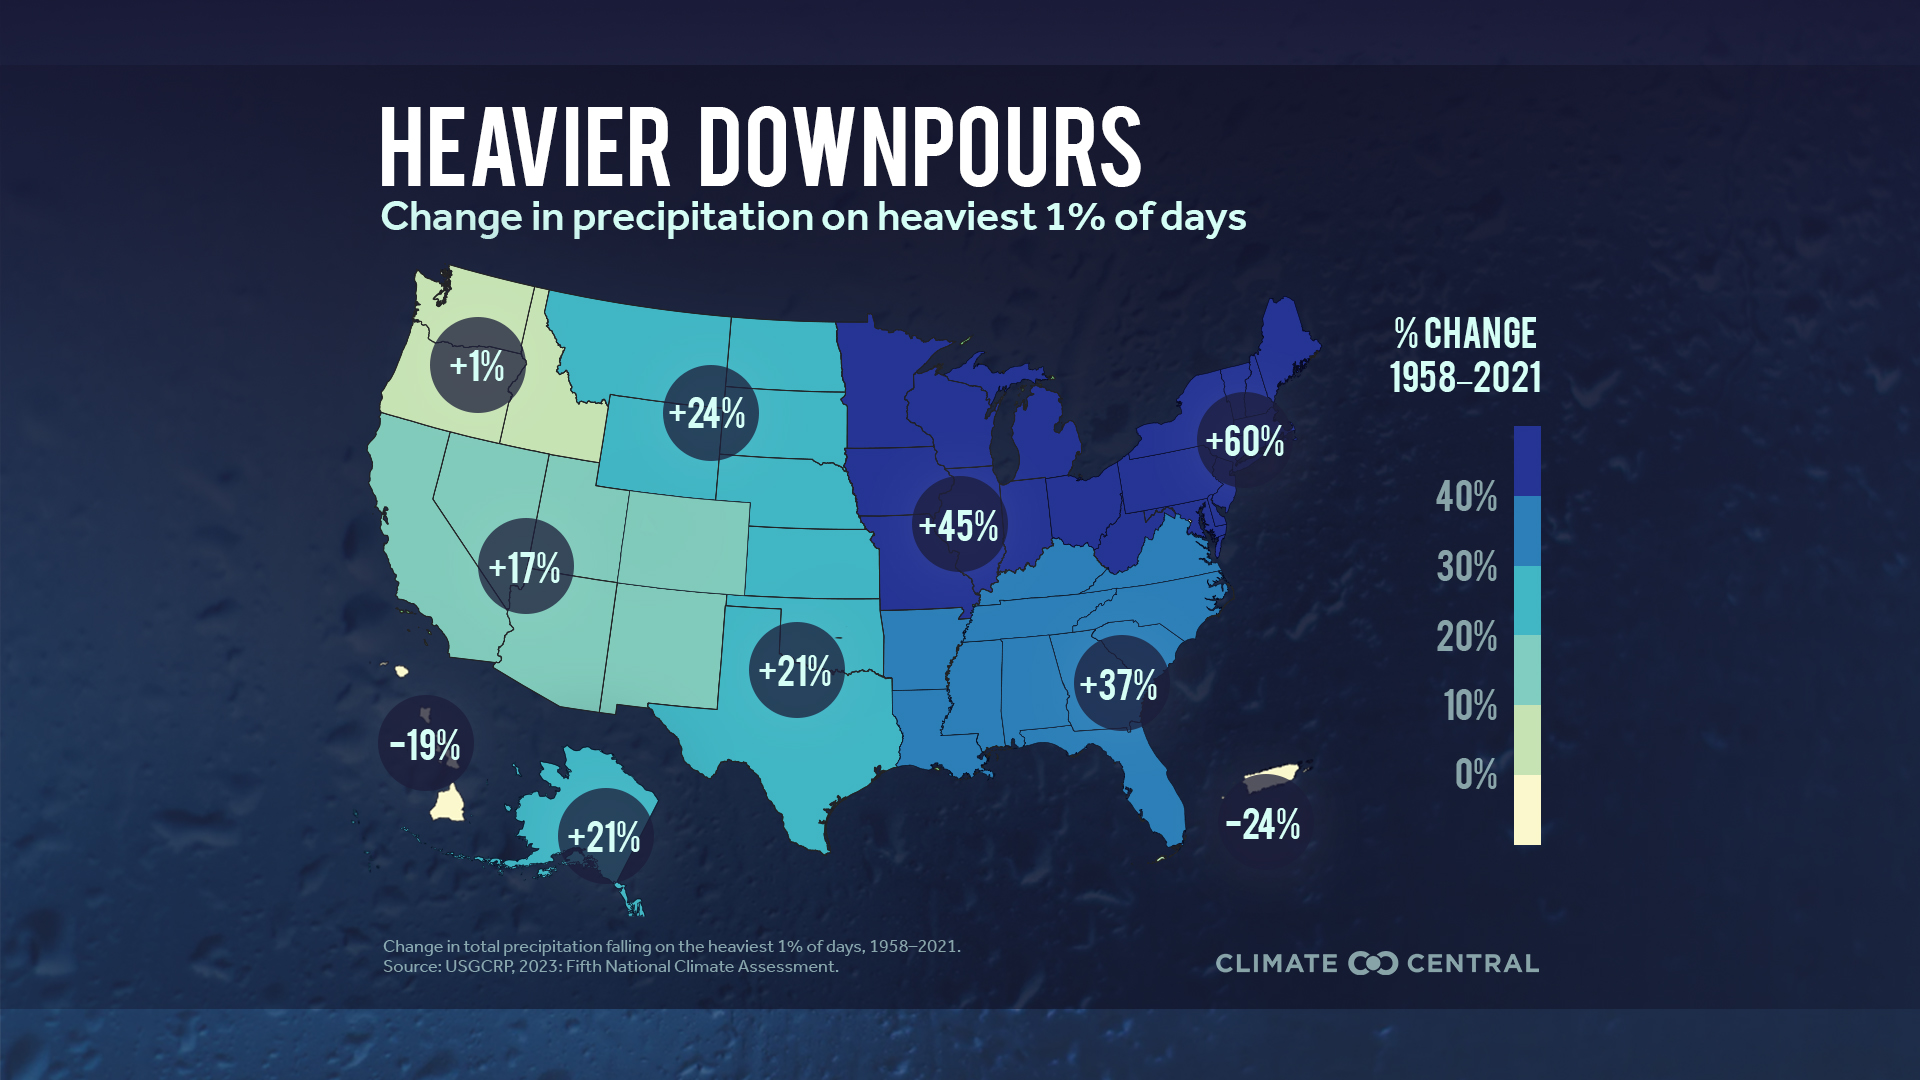
The amount of rainfall during the heaviest rain events each year in the Southeast has increased by 37% since 1958.
Climate change is supercharging the water cycle, bringing heavier precipitation extremes across the U.S.
This chart shows how the amount of rainfall during the top 1% heaviest rain events each year in the Southeast increased between 1958 to 2021.
Data source: Fifth National Climate Assessment
The sea level in South Carolina is projected to rise 1.0 feet by 2050 even if nations meet their pledged commitments to reduce heat-trapping pollution.
Increasing flood risk is driven by our warming climate, which is causing sea levels around the world to rise. Rising sea levels push tides and storm surges higher and farther inland.
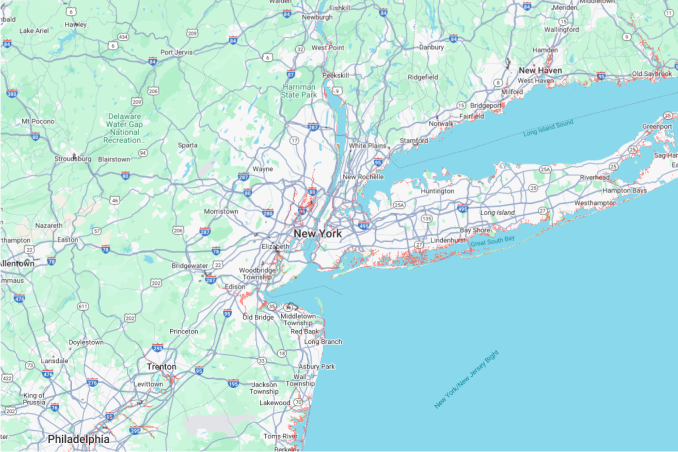
Climate Central’s Coastal Risk Finder provides maps and analysis of the people, homes, and land in the U.S. projected to be at risk from worsening coastal flooding driven by rising seas.
Explore some ways climate change is affecting South Carolina in fall
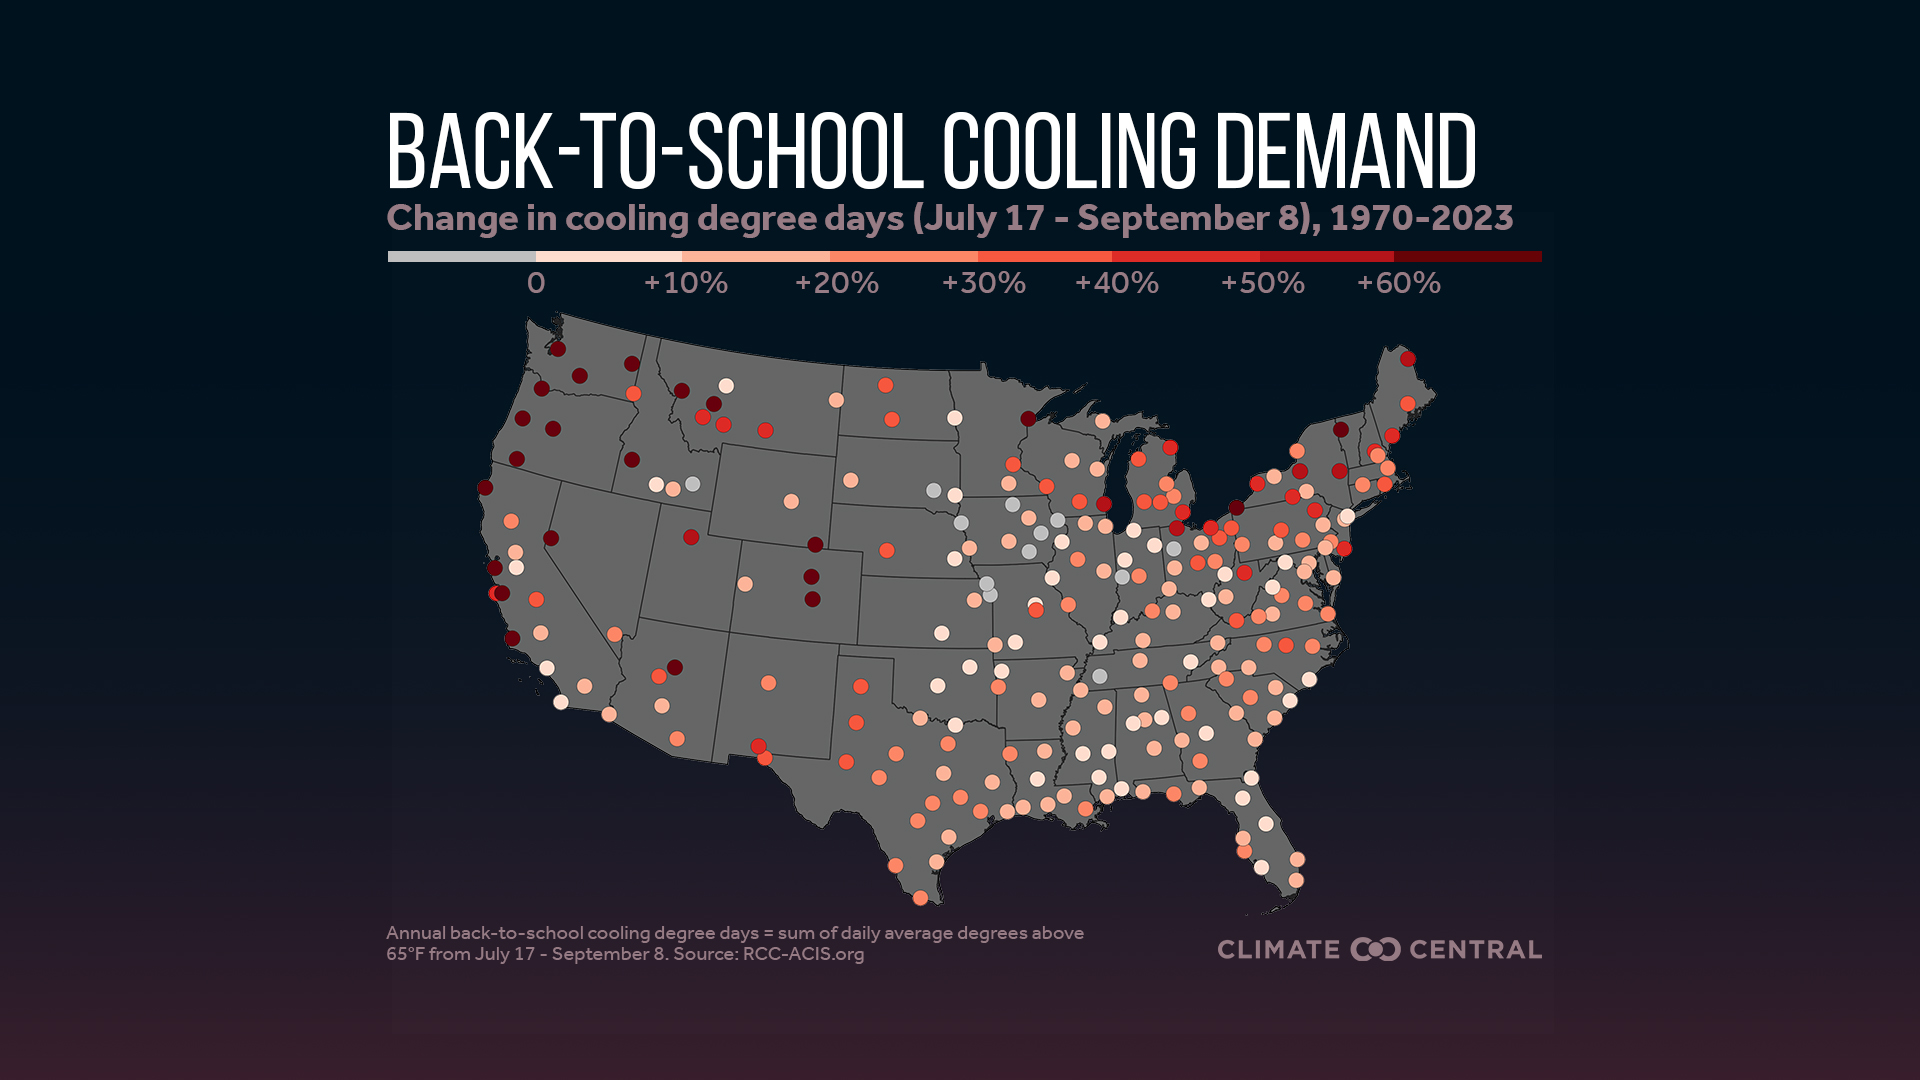
Higher cooling demand for schools
Hotter summers and longer warm seasons make cooling schools a growing challenge.
Key concepts:
- Hotter summers and longer warm seasons make cooling schools a growing challenge.
- Cooling is essential for student and staff health and safety.
- Since 1970, cooling demand during back-to-school season rose in 95% of U.S. locations analyzed.
- Rising demand means schools face costly upgrades to keep classrooms safe and comfortable.
Heavier downpours
Climate change is supercharging the water cycle, driving heavier rainfall and flood risk.
Key concepts:
- Climate change is supercharging the water cycle, driving heavier rainfall and flood risk.
- From 1958–2021, extreme precipitation days grew in every region, led by the Northeast (+60%) and Midwest (+45%).
- Intensification will continue with future warming.
- Short bursts of extreme rain threaten people, ecosystems, and infrastructure nationwide.
More intense hurricanes
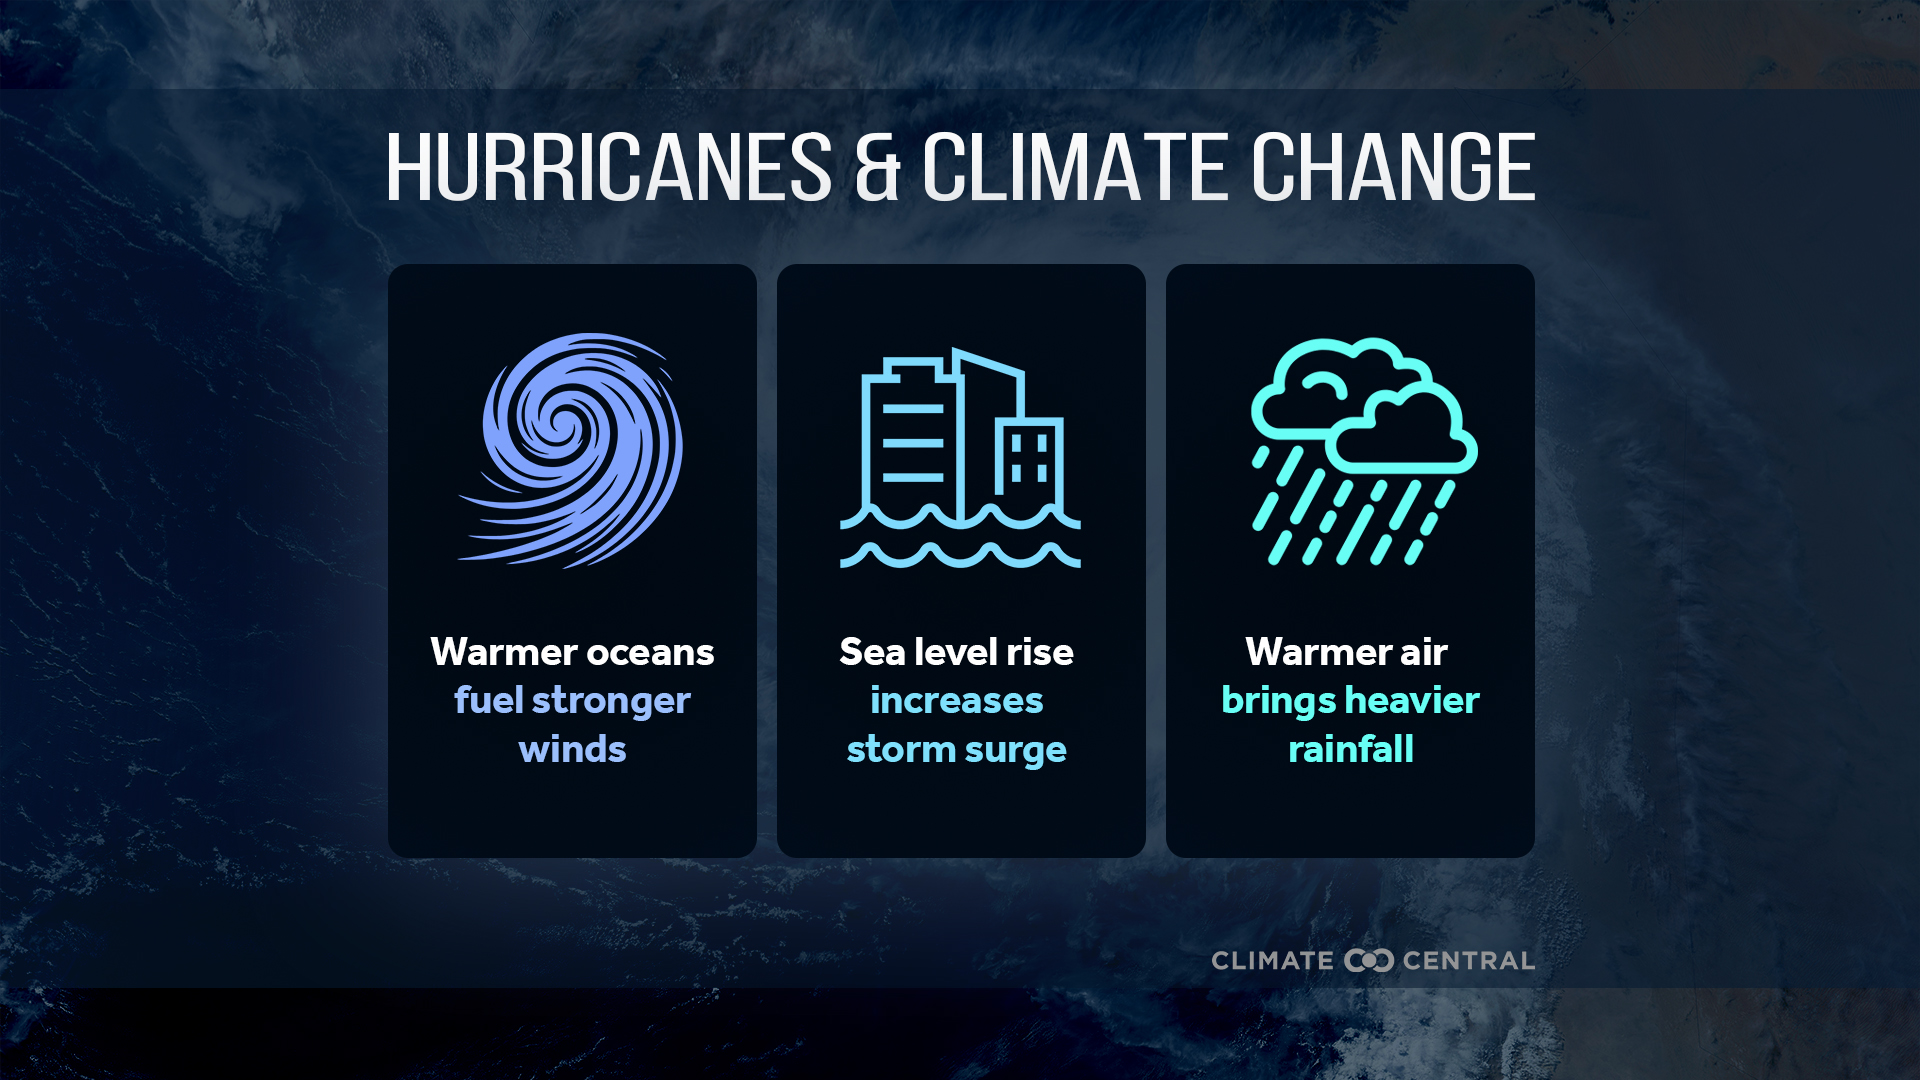
Warmer oceans from climate change fuel stronger hurricanes.
Key concepts:
- Warmer oceans from climate change fuel stronger Atlantic hurricanes with heavier rain and higher storm surge.
- Rising seas amplify storm surge, increasing risks for coastal residents.
- Warmer air holds more moisture, driving heavier downpours and flooding.
More warm fall days
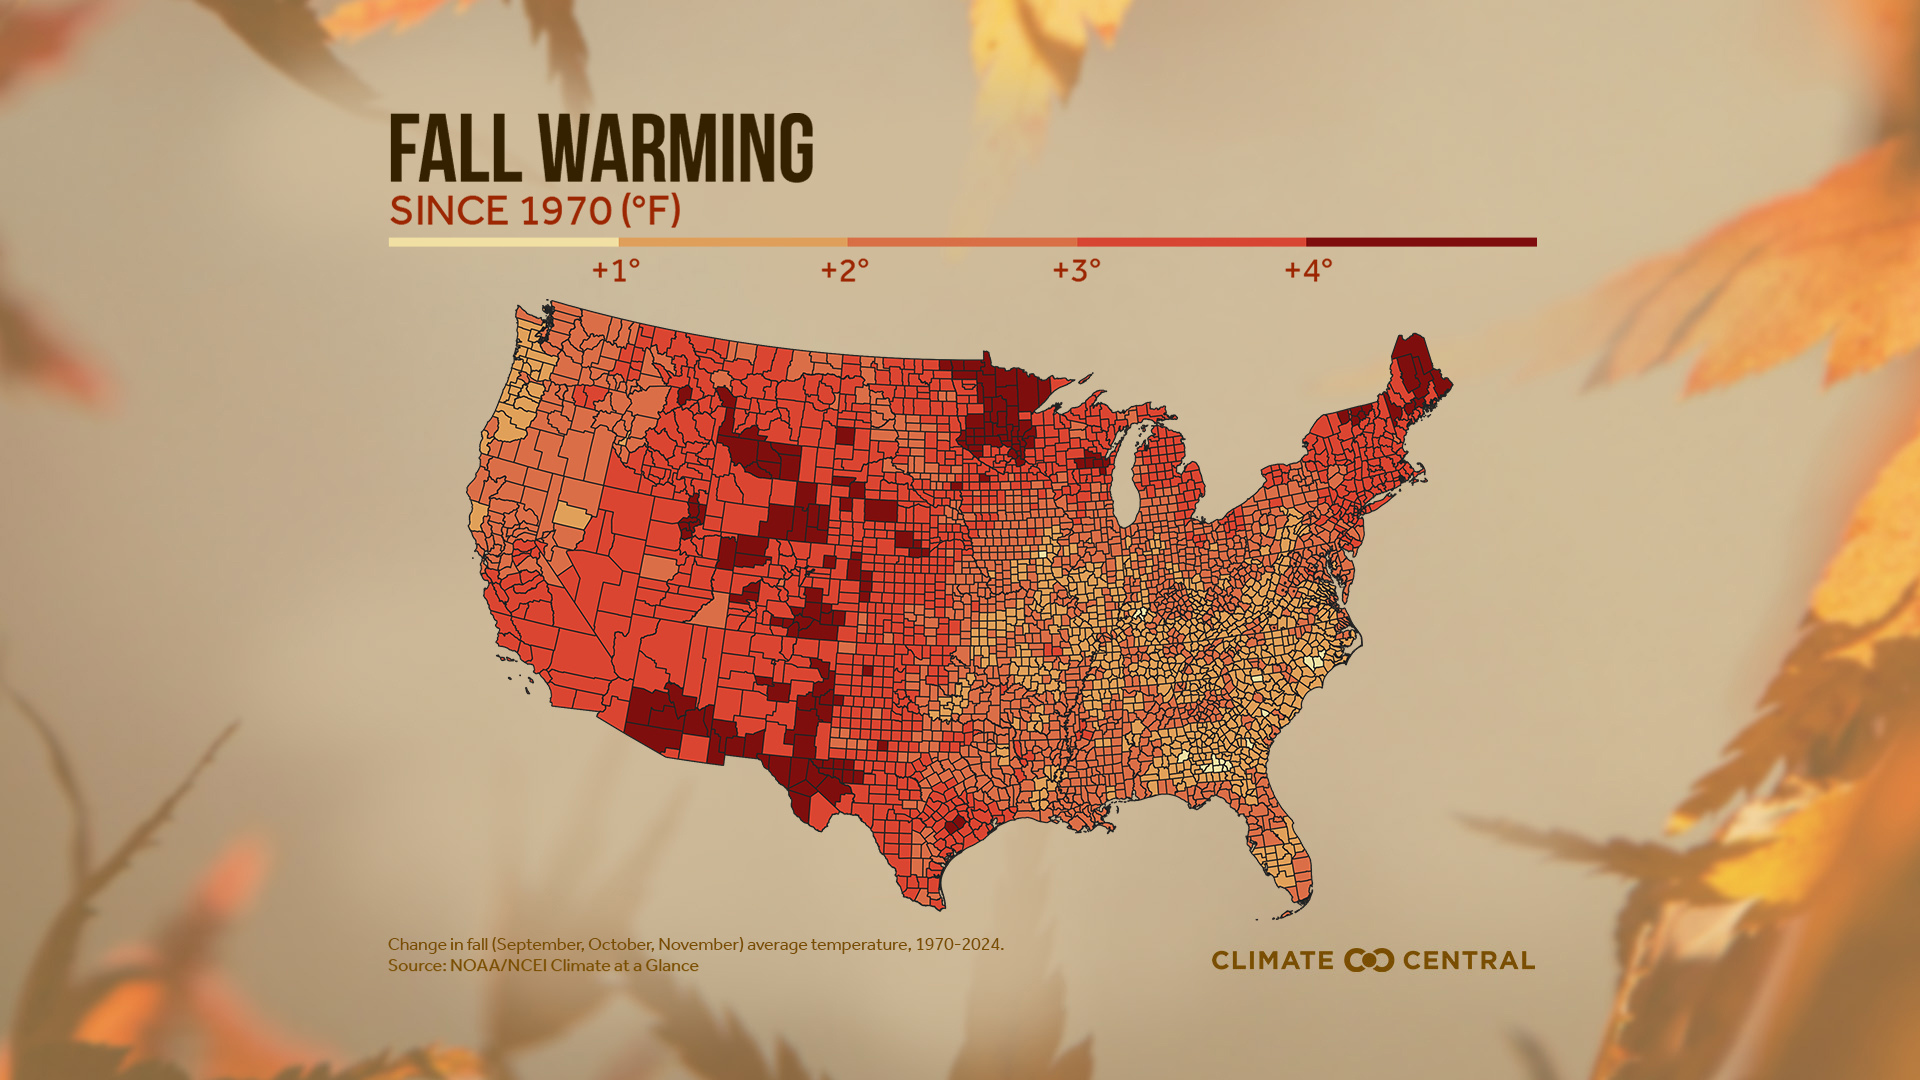
Fall (September-November) has warmed nationwide since 1970.
Key concepts:
- Fall (September - November) has warmed nationwide since 1970.
- Warming is nationwide, strongest in the Southwest.
- Hotter falls extend risks from heat, wildfire, allergies, and more.
More coastal flooding
In the U.S., coastal floods now happen three times more often than they did 30 years ago.
Key concepts:
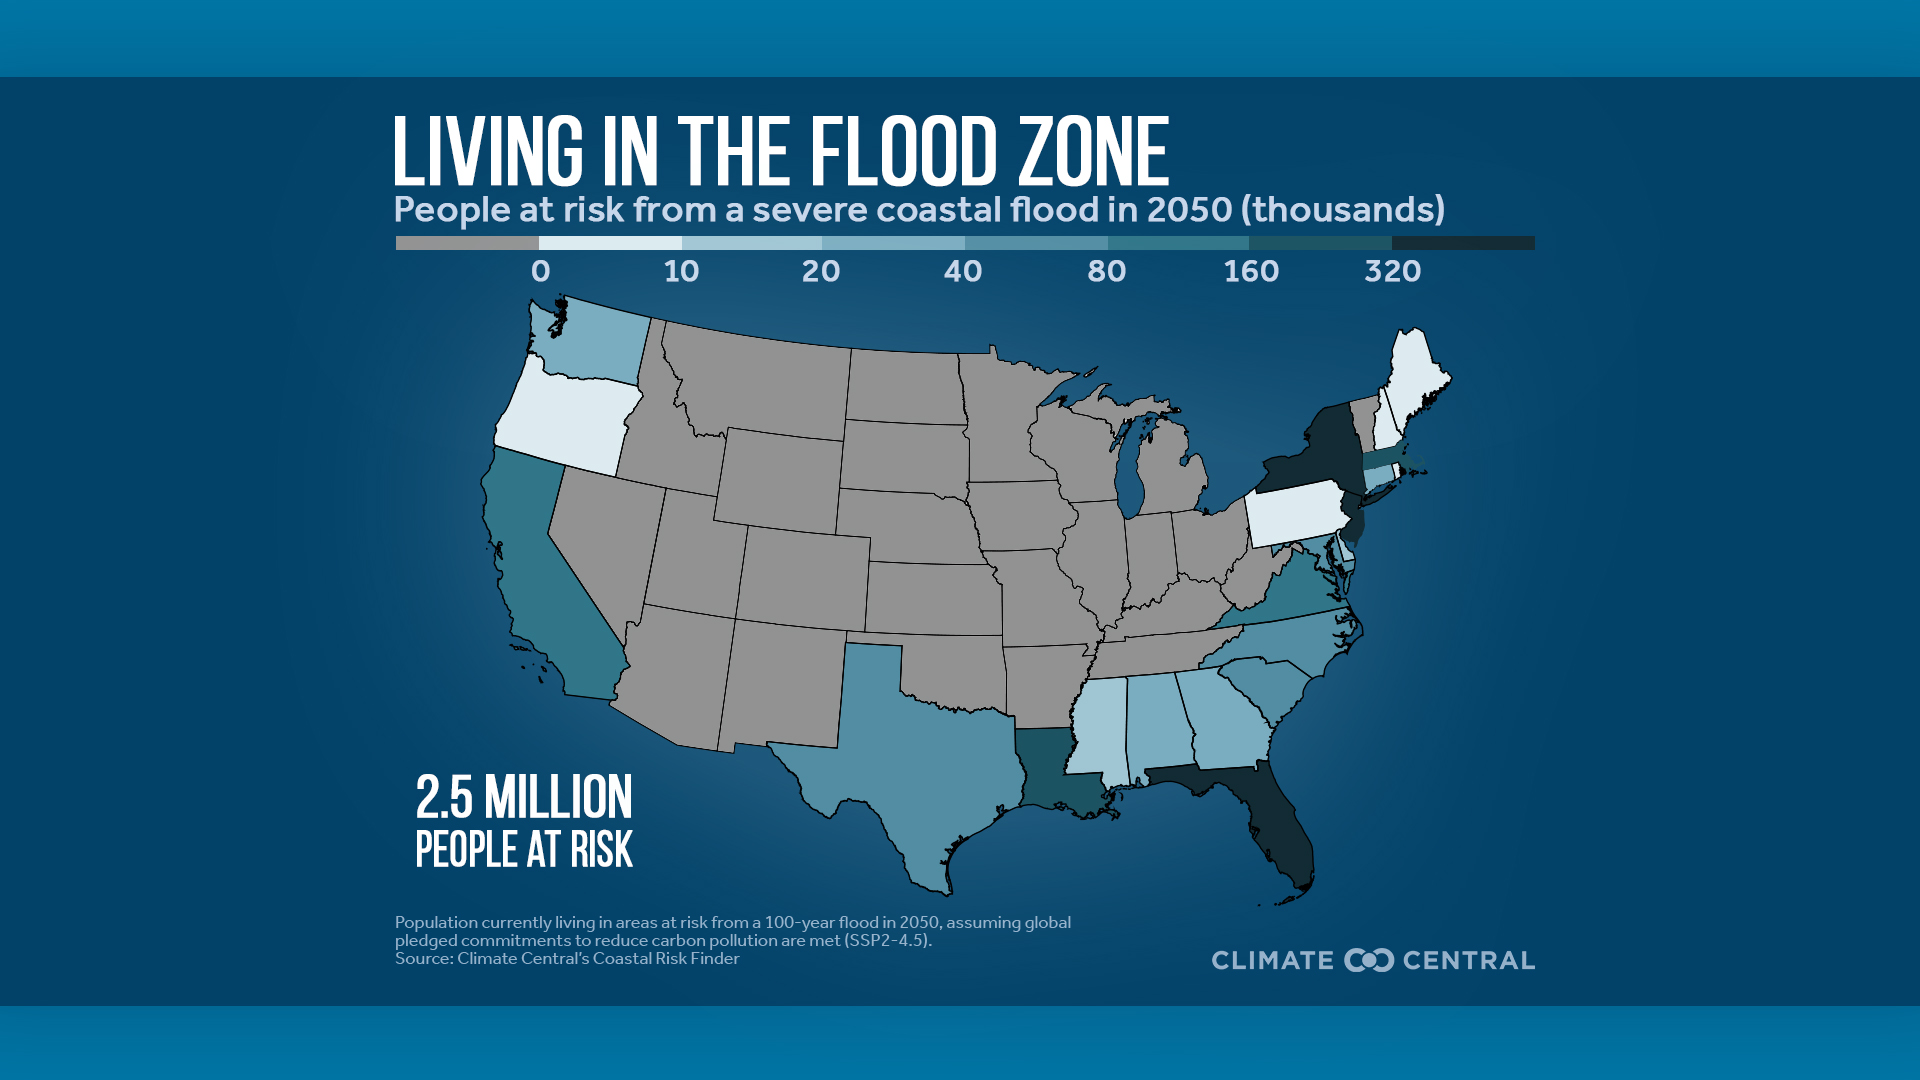
- Climate Central’s Coastal Risk Finder provides maps and analysis of the people, homes, and land at risk from worsening coastal flooding driven by rising seas in the contiguous U.S.
- Around 2.5 million Americans in 1.4 million homes live in areas at risk from a severe coastal flood in 2050 under projections that assume global pledged commitments to reduce carbon pollution are met.
- Florida, New York, and New Jersey have the most people and homes in areas at risk from a severe coastal flood.
- Older adults are disproportionately exposed to coastal flood risk. Nearly 540,000 people aged 65 and older live in at-risk areas.
Impacts to food prices
Extreme events fueled by climate change can damage crops, reduce yields, and disrupt supply chains.
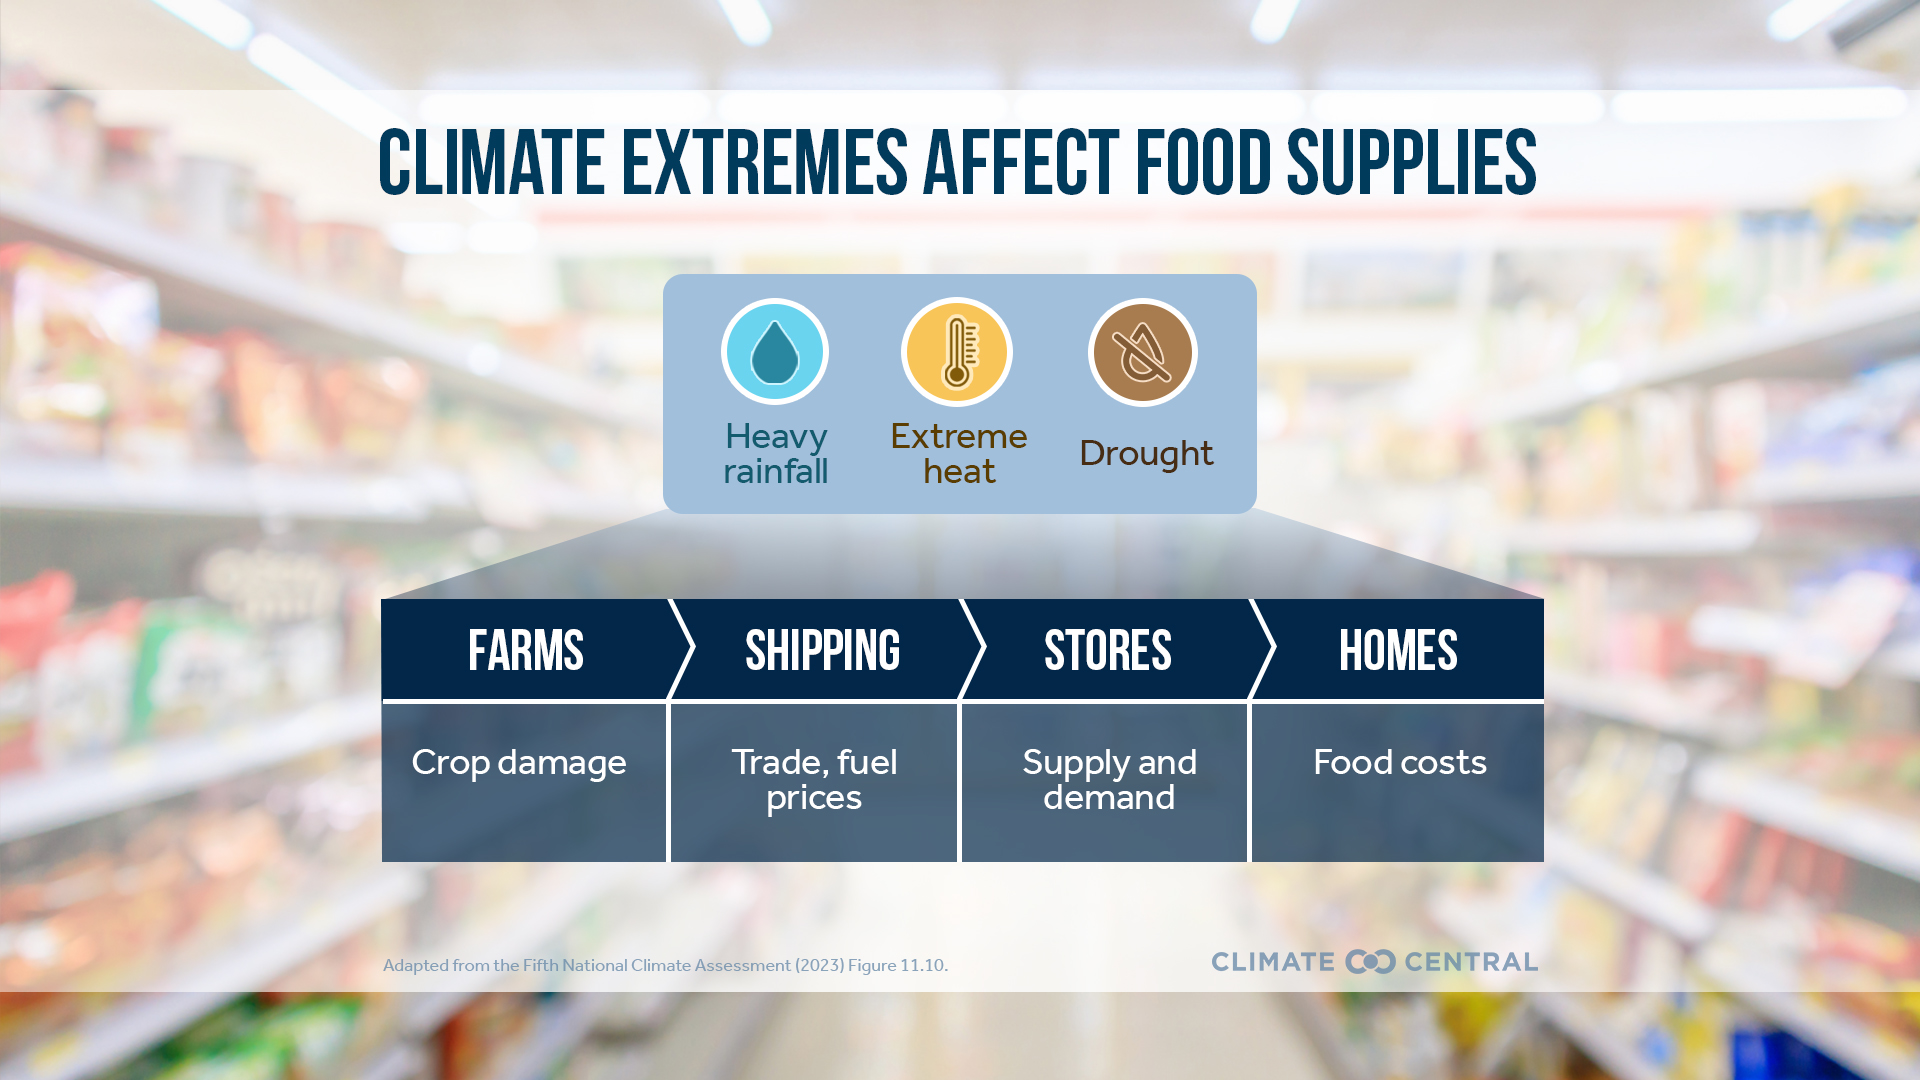
Key concepts:
- Food and climate change are closely linked. Food systems account for about one-quarter of all heat-trapping pollution.
- Meanwhile, extreme events fueled by climate change can damage crops, reduce yields, and disrupt supply chains — all of which can drive food prices higher.
- The availability, quality, and affordability of food reflect a complex set of climatic and socioeconomic factors. Emerging research is providing insight into the role of climate change.
More graphics about South Carolina and climate change
Browse climate-related graphics for all seasons localized for South Carolina, available for download and use consistent with our Terms of use.