Climate Matters•July 19, 2023
Hotter Climate, Higher Cooling Demand
KEY CONCEPTS
As our climate gets hotter, cooling demand is rising quickly around the world.
Annual cooling degree days—a measure of cooling demand—have increased since 1970 in 232 (97%) of the 240 U.S. locations analyzed by Climate Central.
The observed rise in cooling demand is likely to continue as the planet warms.
Access to cooling is critical to ensure health and safety in our rapidly warming world.
But the increased energy use needed to meet rising cooling demand can drive up emissions, strain power grids, and worsen urban heat islands.
Solutions include cutting emissions to slow the rate of warming, transitioning to renewable energy supplies, and adopting high-efficiency cooling appliances such as heat pumps.
As our climate gets hotter, cooling demand rises
As the planet warms and both scorching days and sweltering nights occur more often, more cooling is needed to keep homes, schools, offices, and hospitals at comfortable temperatures.
Cooling demand is reflected in a temperature-based metric called cooling degree days (CDD). CDD values estimate how much cooling is needed to maintain a comfortable indoor air temperature.
CDD values are the difference between a location’s daily average outdoor temperature and 65°F, an engineering standard that is considered the ideal indoor temperature.
For example, a day with an average temperature of 90°F has 25 CDD (90°- 65°).
Daily CDD values—and therefore estimated cooling demand—are highest on the hottest days of the year. But any day over 65°F—including warm spring and fall days—has a CDD value. A location’s annual CDD value is the sum of daily CDD accumulated over the course of a calendar year.
Rising cooling demand in 232 U.S. locations
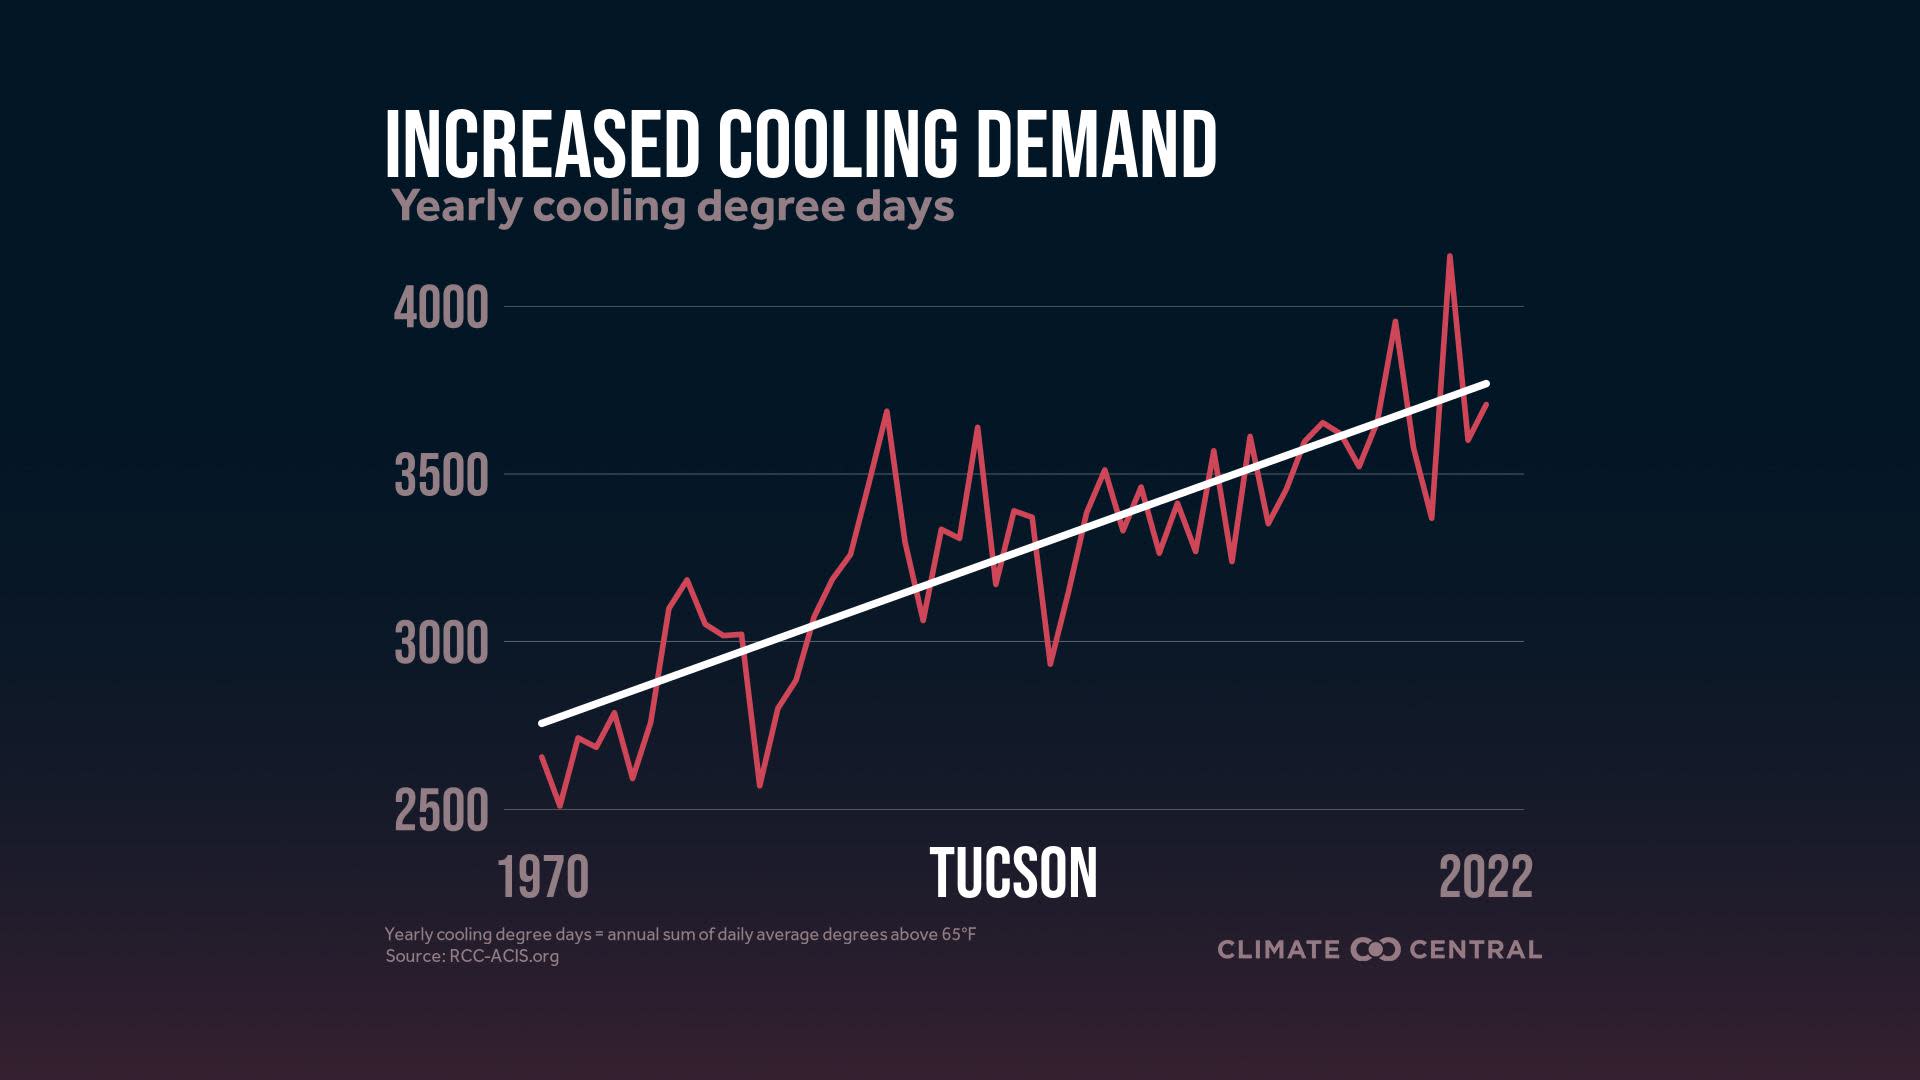
Climate Central used historical temperature data to analyze the change in annual CDD values from 1970 to 2022 in 240 U.S. locations. These trends estimate the changing local demand for energy to cool homes and buildings as the climate has warmed since 1970.
Of the 240 total locations analyzed, 232 (97%) have experienced an increase in annual CDD since 1970.
The largest increases in annual CDD since 1970 were in the Southwest, South, and Southeast. These regions spend a much larger share of home energy budgets on air conditioning (up to 27% in Gulf Coast states) compared to the national average (12%).
States that saw the largest increase in CDD since 1970 were: Nevada, Arizona, Utah, Texas, and Florida.
The locations with the largest increase in CDD were: Las Vegas, Nev.; McAllen, Texas; Phoenix, Ariz.; Reno, Nev.; El Paso, Texas; Tucson, Ariz.; and Albany, Ga.
Rising temperatures, rising cooling demand
The observed rise in cooling demand since 1970 is a trend that’s likely to continue as the planet warms.
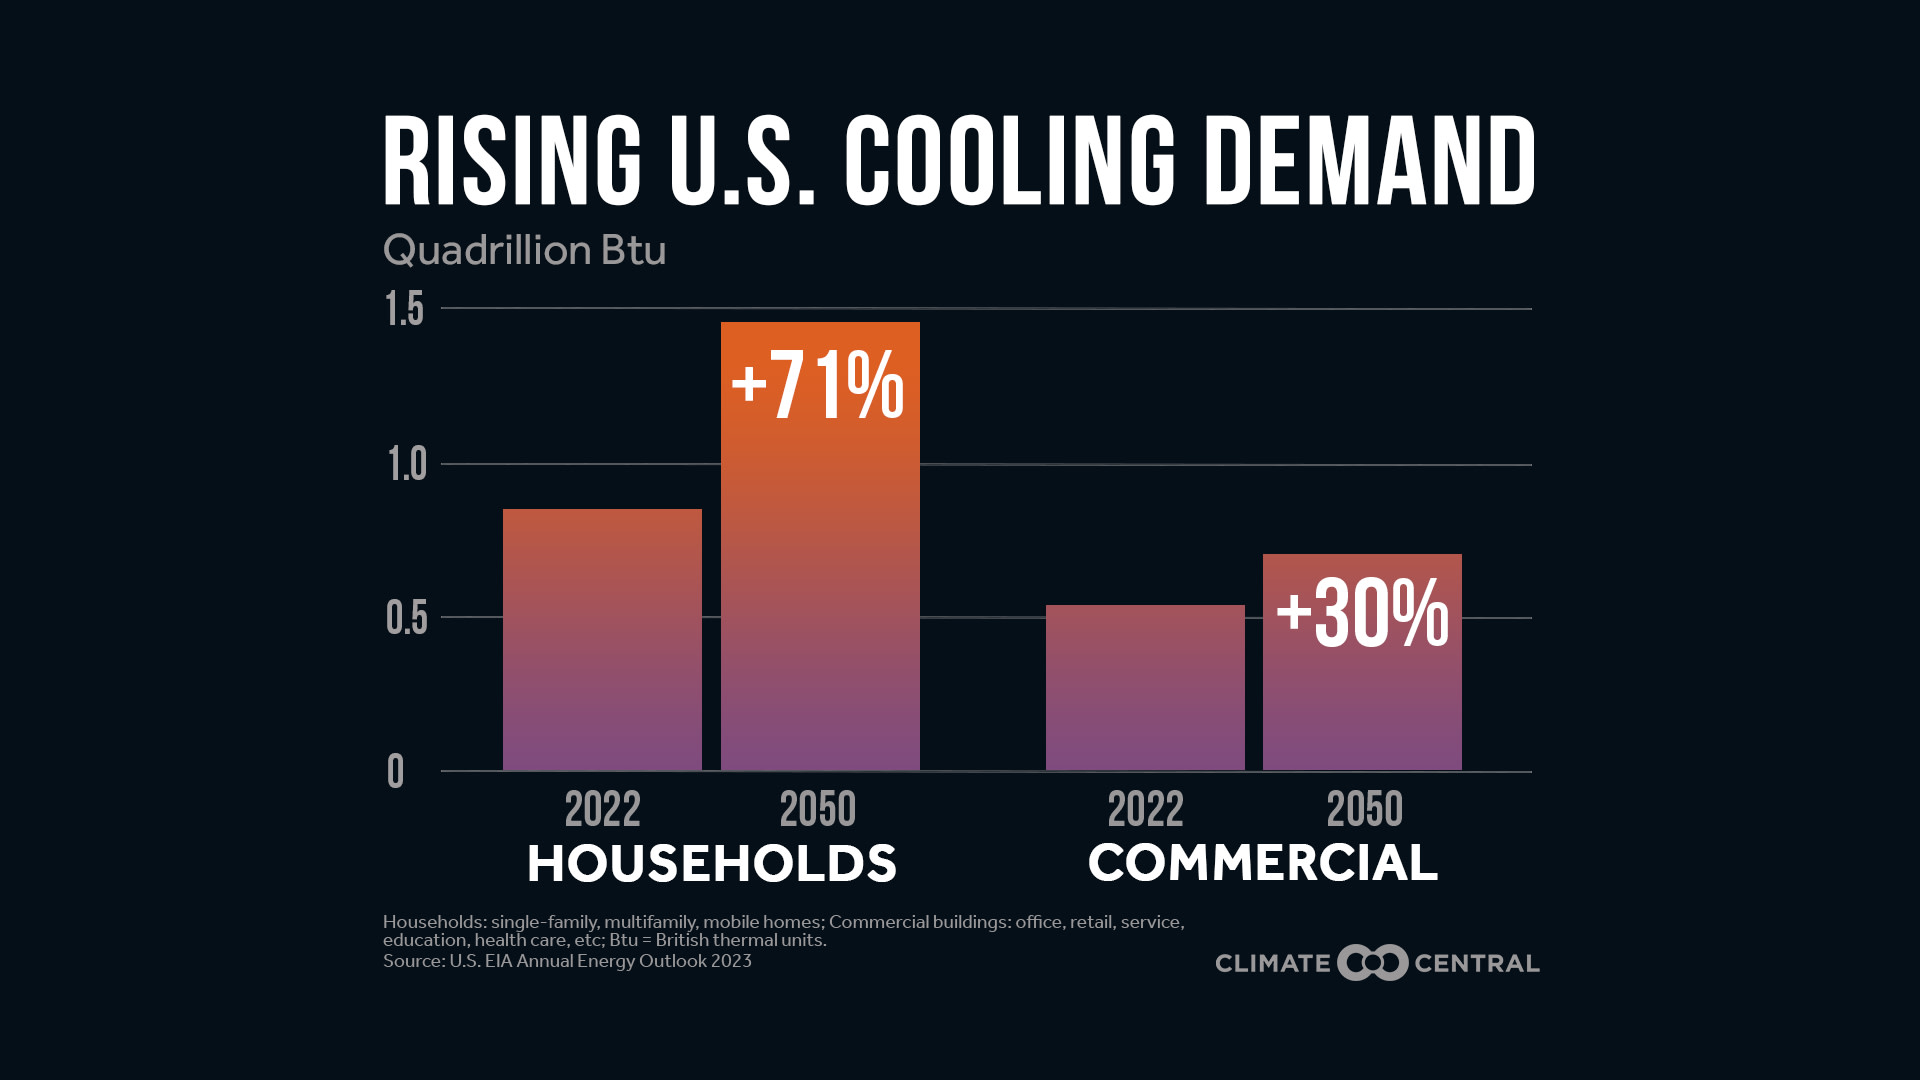
In the U.S., projected changes in CDD are expected to drive a 71% increase in household cooling demand by 2050, according to the U.S. Energy Information Administration’s latest outlook. Commercial buildings are projected to see a 30% increase in cooling demand over the same period.
These large future projections are likely under-estimates because they’re based on air temperature (CDD) and therefore don’t account for additional cooling demand due to humidity.
Rising demand for cooling isn’t limited to the U.S., where 90% of households already have air conditioning. Globally, cooling demand is expected to more than triple by 2050 (consuming as much electricity as all of China and India today) as countries around the world heat up and gain access to air conditioning.
According to a July 2023 study, if we overshoot the Paris Agreement’s aspirational 1.5°C (2.7°F) warming limit (likely by 2034) and the planet warms by 2°C (3.6°F) above pre-industrial levels, the world would need much more cooling. The largest increases in cooling demand in a 2°C warmer world are expected in Sub-Saharan Africa.
More cooling = more heating?
Access to indoor cooling is critical to ensure health and safety in a rapidly warming world with more frequent and intense extreme heat events. Air conditioning allows us to work and learn effectively, keeps food and medical supplies safe, and reduces the risk of heat-related illnesses.
But increased energy use needed to meet accelerating cooling demand can strain electricity grids, drive up emissions, and worsen urban heat islands. Side effects of rising cooling demand include:
The energy used to cool buildings currently relies heavily on fossil fuels. Without decarbonizing energy supply, more cooling therefore means higher carbon pollution and more warming.
The growing demand for air conditioning can strain power grids. This can become dangerous, especially if a power grid fails during a heatwave.
Chemicals used in air conditioning, such as hydrofluorocarbons (HFCs), are extremely powerful greenhouse gases with a global warming potential far greater than carbon dioxide. Global agreements in place aim to phase down HFCs in the decades ahead.
Air conditioners emit waste heat back outside. In a city with millions of air conditioners running and releasing waste heat into the outside air, it can increase the urban heat island effect.
Unequal energy burdens
Higher cooling demand means higher energy bills and higher risks among households that lack or cannot afford to run air conditioning systems.
Although only 10% of U.S. households don’t have air conditioning, households that do lack air conditioning tend to be low-income.
Within cities with relatively low rates of home air conditioning there are large racial gaps in access, with Black and Hispanic households more likely than white households to lack air conditioning.
The financial burdens of home cooling fall disproportionately on low-income households.
A 2020 report from the American Council for an Energy-Efficient Economy found that 67% of low-income households nationwide face high energy burdens (spending more than 6-10% of their income on energy bills).
A 2022 study found that, due to their higher energy burden, low-income households in Arizona start using home cooling at 5° to 7°F higher outdoor temperatures than high-income households.
Renewable, resilient grids
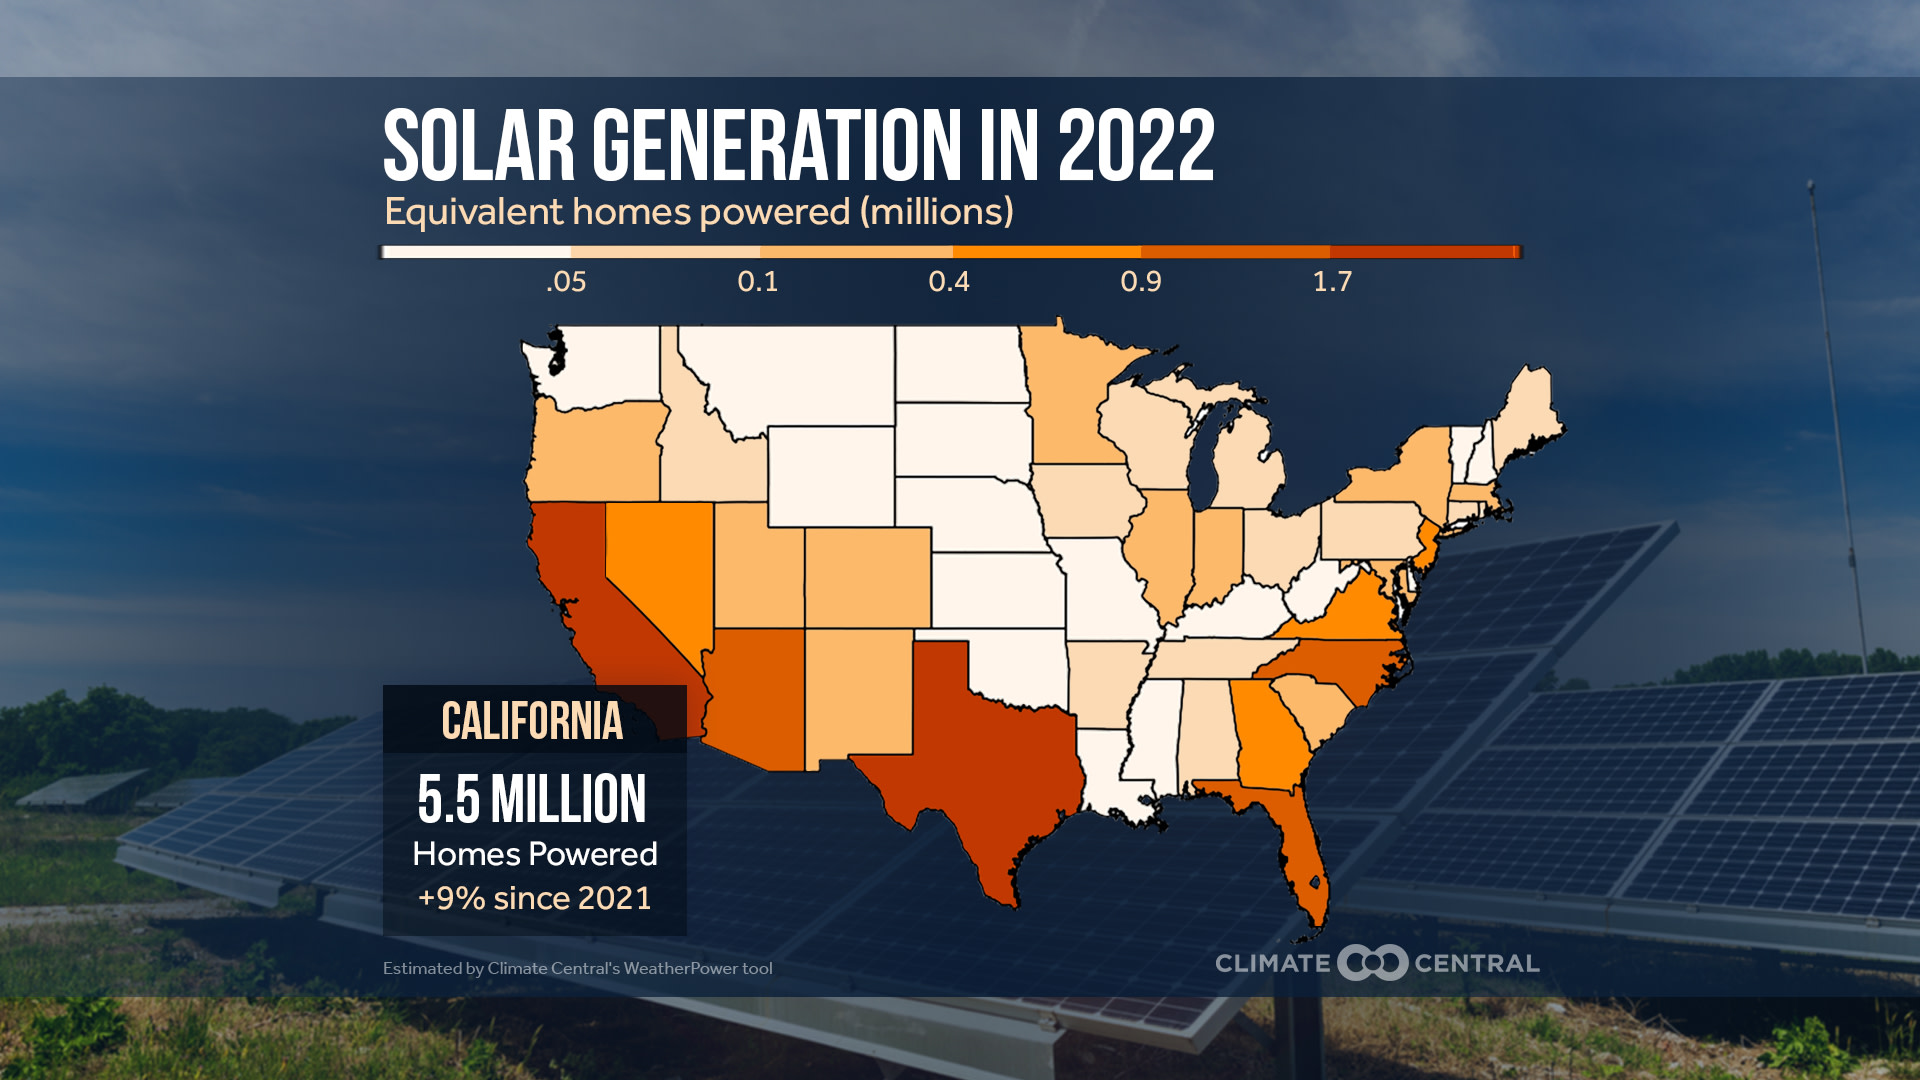
A key solution to curb the negative effects of rising cooling demand is to transition to low-carbon energy supplies that replace fossil fuels with renewables such as solar and wind. This would allow us to stay cool without warming the planet.
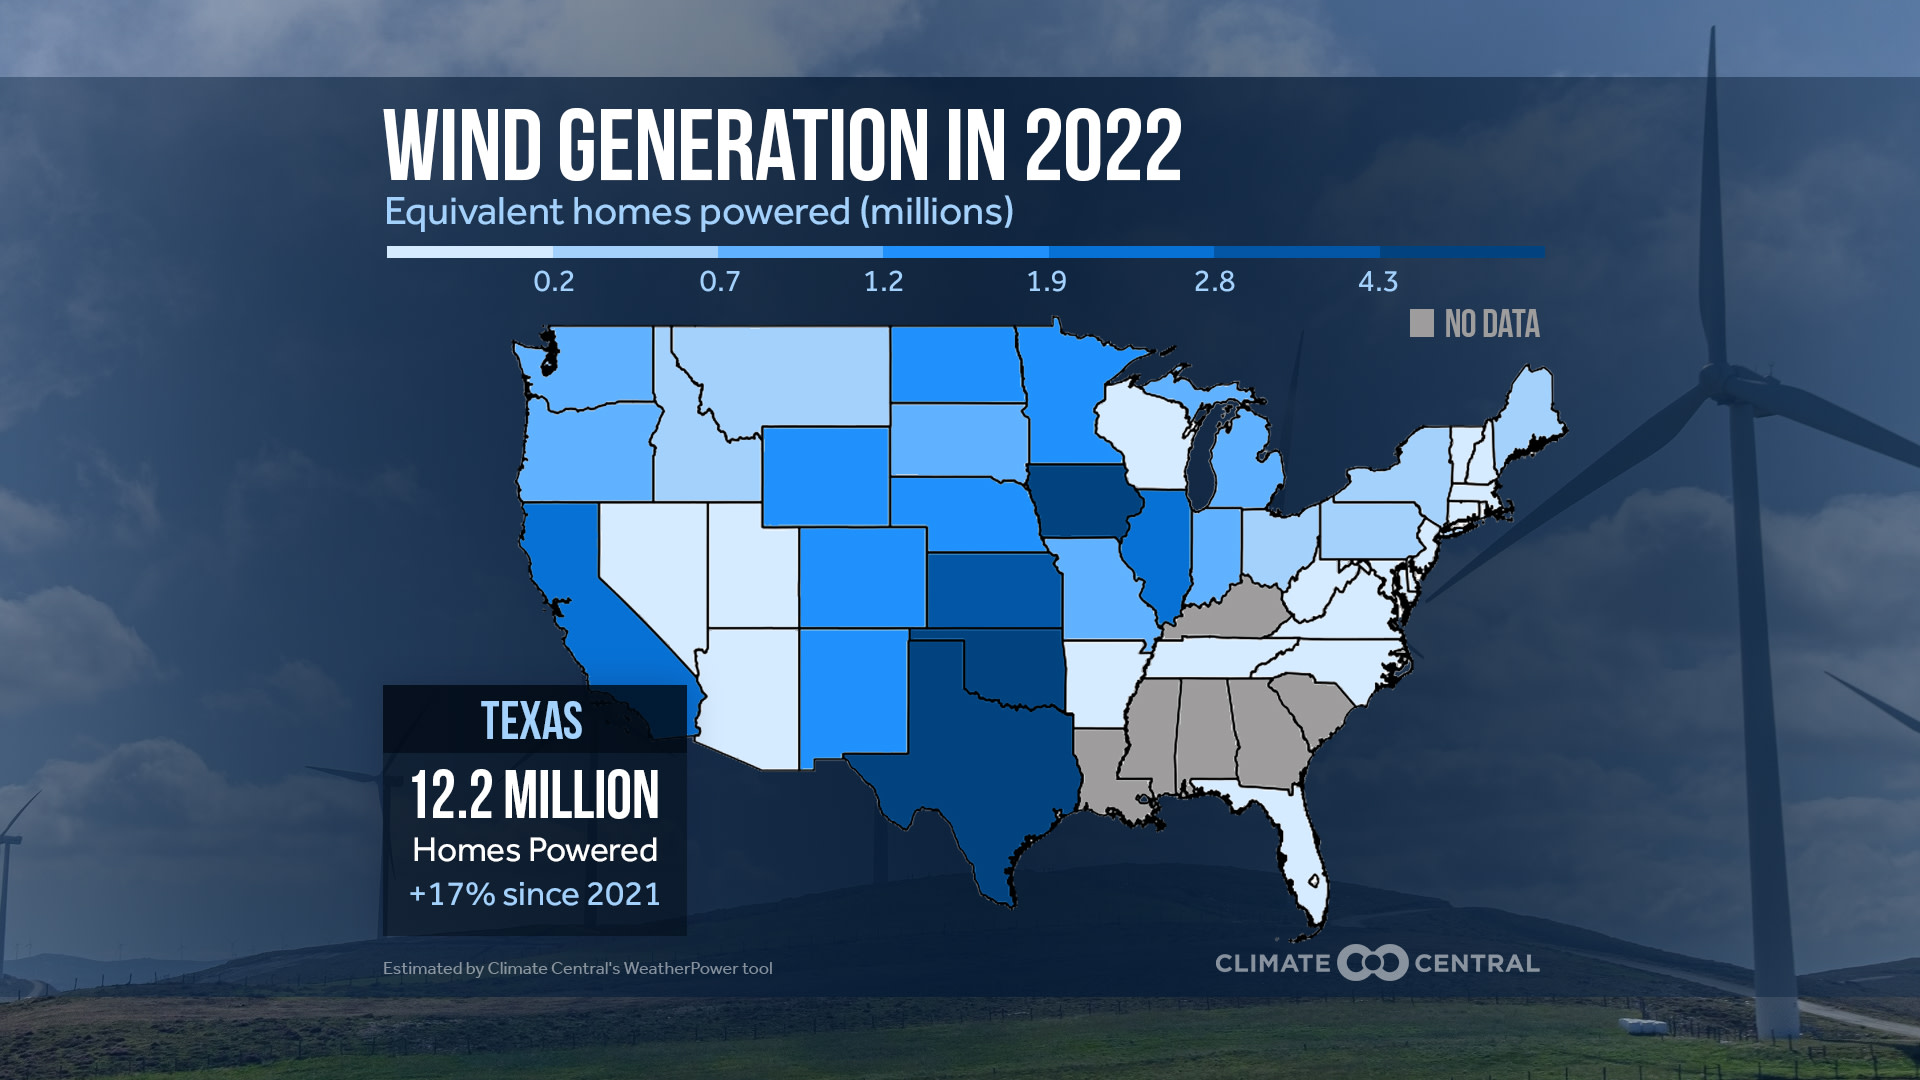
Renewable energy has helped homes and businesses in Texas meet the increased cooling demand during the region’s extreme and prolonged heat event since mid-June 2023.
Specifically, wind and solar energy, of which Texas is a top producer nationwide, have helped meet the prolonged spike in energy demand.
Renewable energy generation reached a record of 31,498 MW on June 28—enough to power more than 6 million homes.
The Electric Reliability Council of Texas reports that 1 MW could power about 200 homes during peak demand.
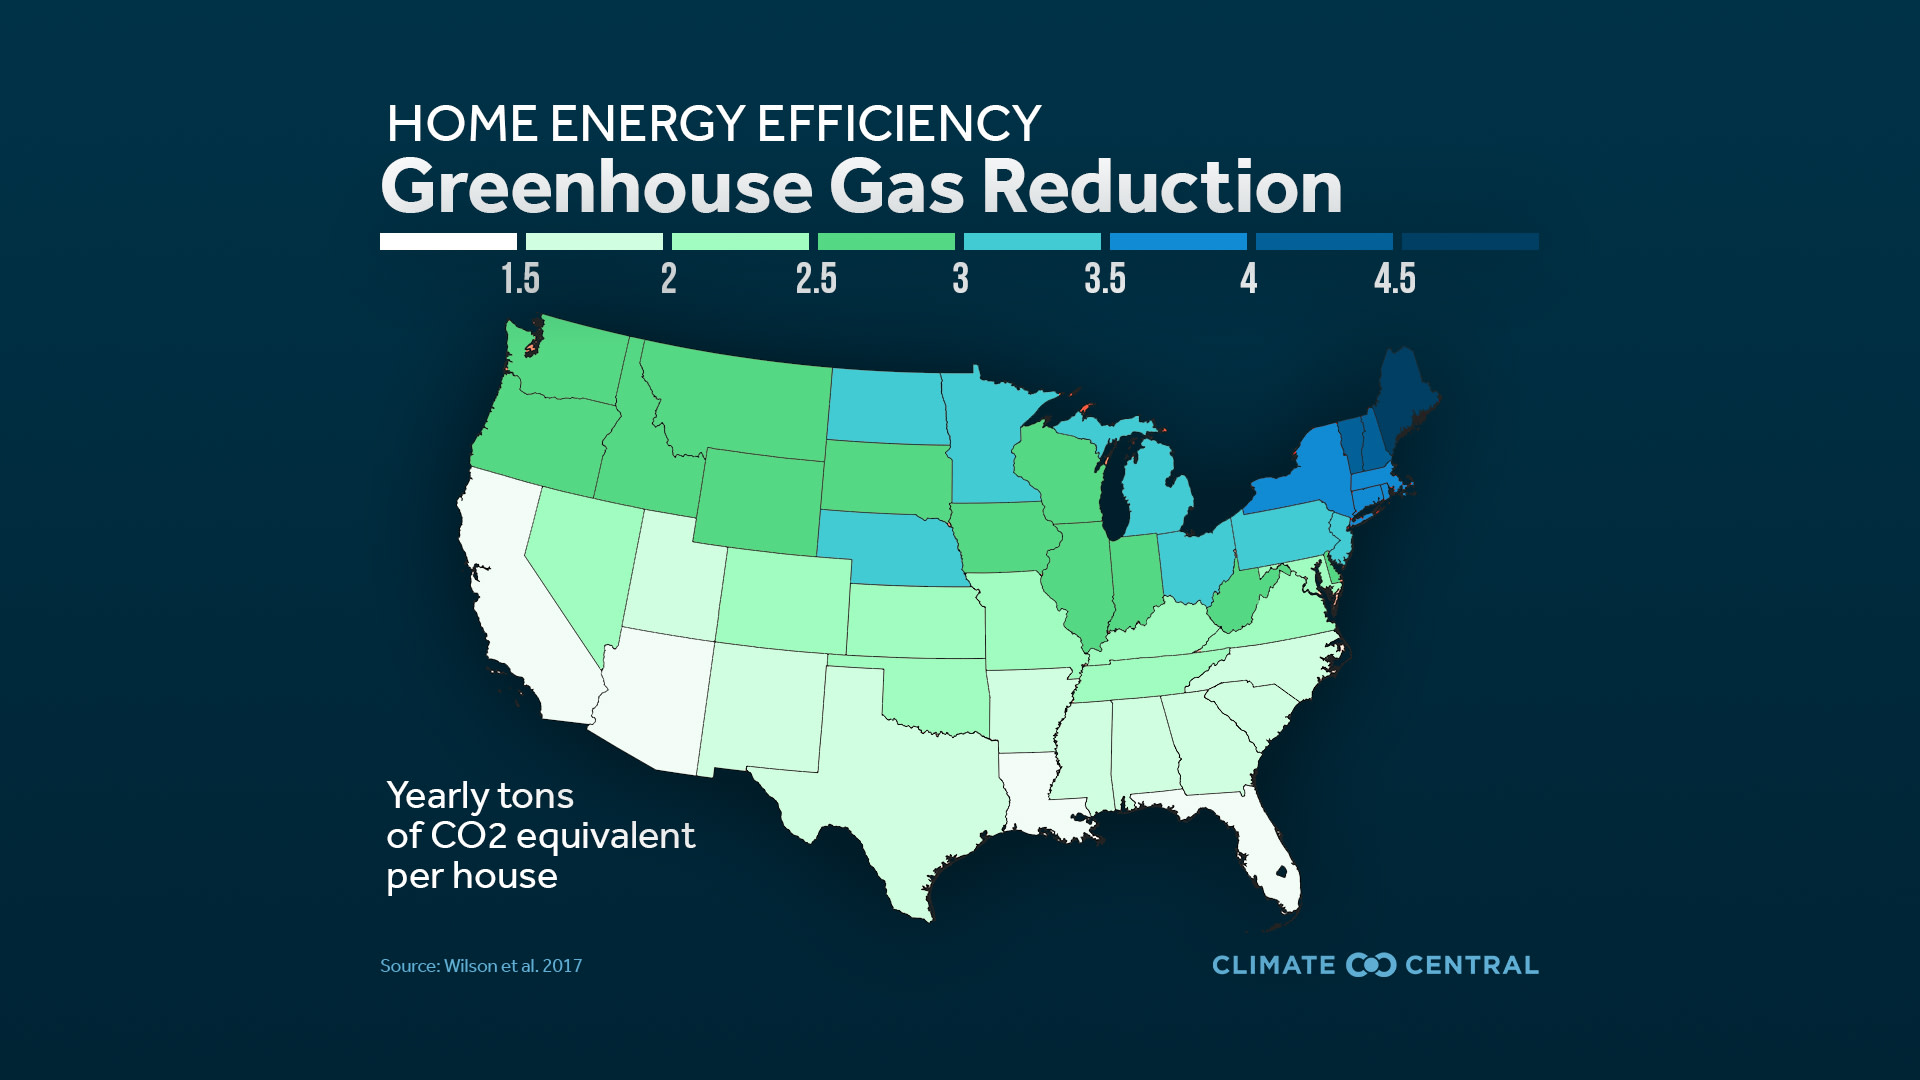
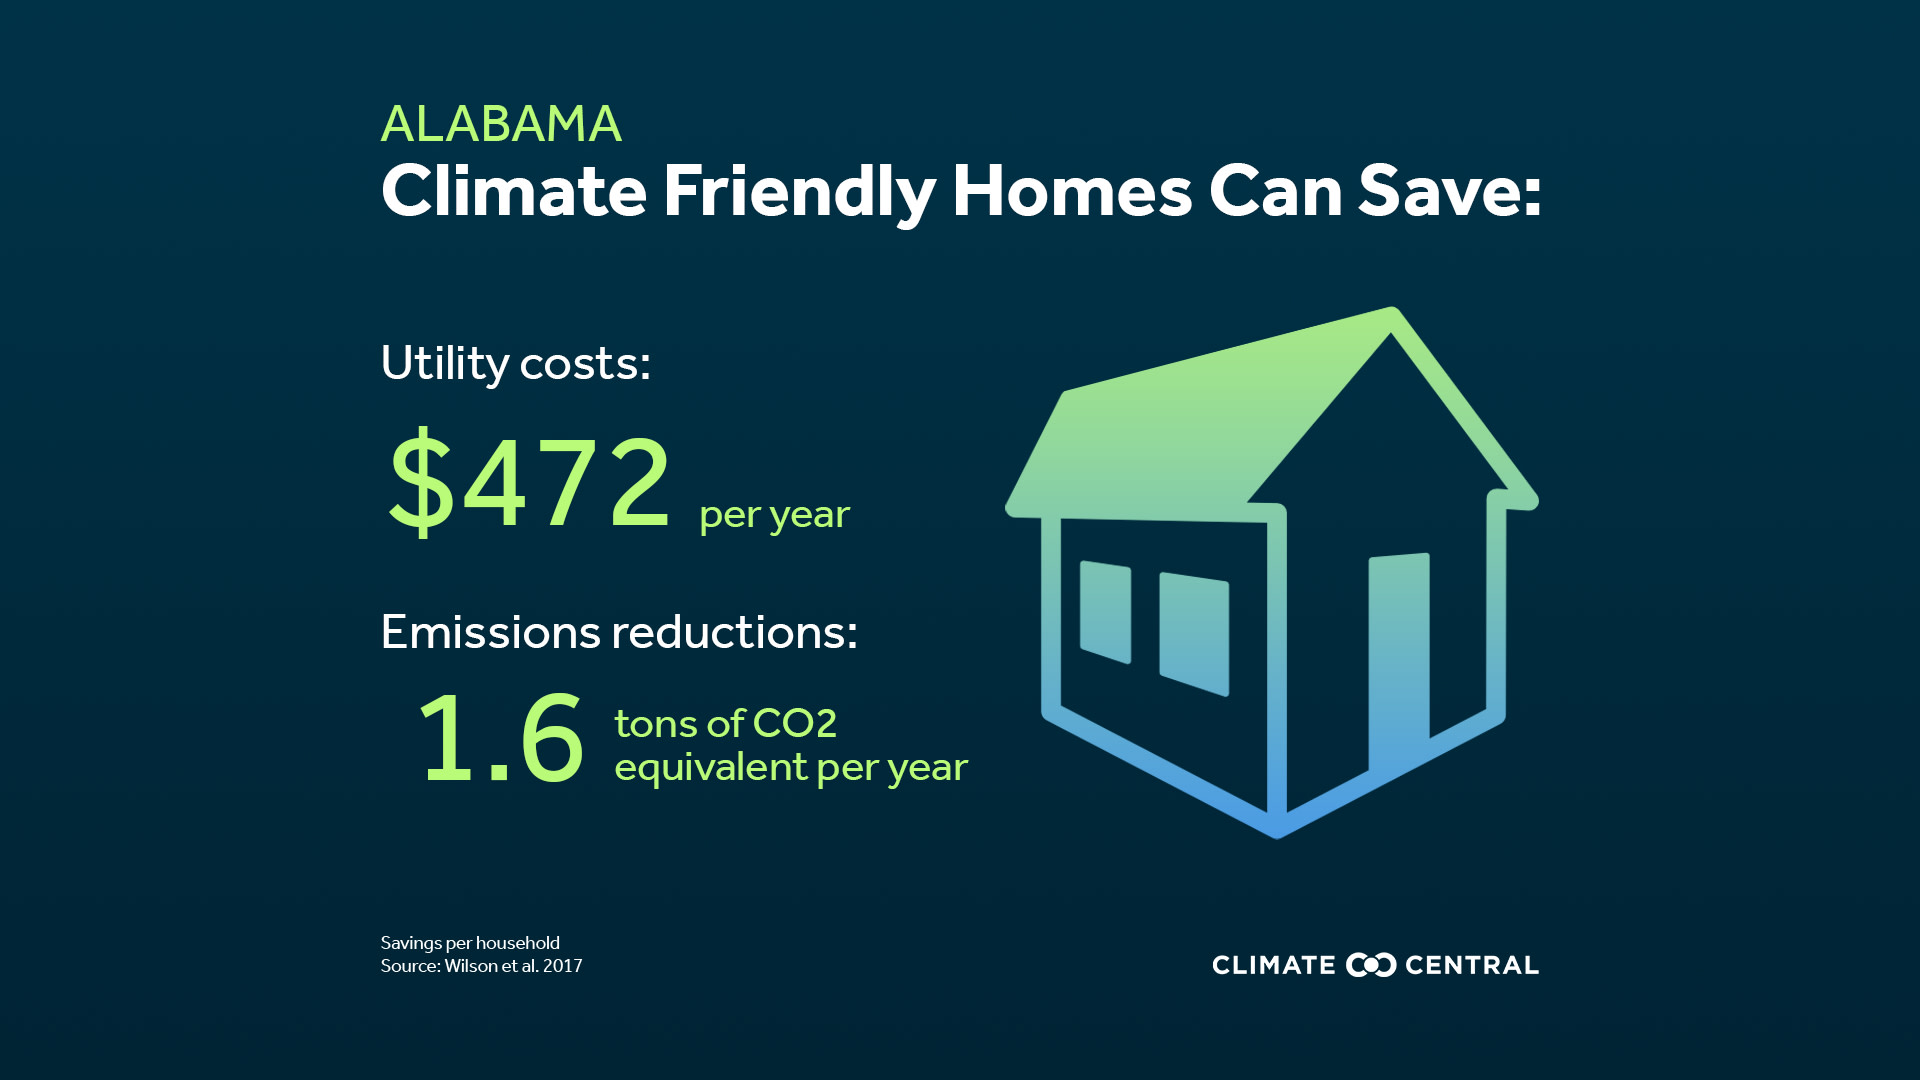
More efficient homes and appliances
Adopting efficiency and electrification measures can reduce carbon emissions of single family homes by 24%, according to research from the National Renewable Energy Laboratory.
Replacing both an inefficient electric furnace and air conditioner with a single high-efficiency heat pump can reduce electricity use significantly and save on energy bills. The Inflation Reduction Act provides tax credits for the installation of heat pumps.
A study from RMI found that electrification of heating and air conditioning can reduce homeowners’ costs over an appliance’s lifetime compared to fossil fuel-based models.
Retrofitting current buildings with better windows and insulation can further increase efficiency.
In March 2023, the U.S. finalized new energy efficiency standards for room air conditioners. These standards will go into effect in 2026 and are expected to result in reduced home electricity bills and reduced carbon pollution.
Learn more in Solutions Series: Creating Climate-Friendly Homes.
LOCAL STORY ANGLES
How is energy consumption changing in your region?
Check out the U.S. Energy Information Administration state-level statistics, including energy consumption by source, sector, prices and more. Explore NOAA’s Residential Energy Demand Temperature Index (REDTI). Based on cooling and heating degree days, REDTI helps explain year-to-year fluctuations in residential heating and cooling demands.
What is the role of renewable energy in your state and city?
Read our report WeatherPower: 2022 in Review for a summary of solar and wind energy generation in 2022. Climate Central’s WeatherPower tool shows daily wind and solar electricity generation based on weather of the day and installed capacity in your area.
Are there ways to cool homes while also saving on energy bills?
The National Center for Healthy Housing lists cooling centers by state. The U.S. Department of Energy shares cooling tips. Low Income Home Energy Assistance Program (LIHEAP) helps alleviate heat stress for the most vulnerable populations, by helping with energy bills and making homes more energy efficient. Find rebates on ENERGY STAR, certified energy efficient products. The Inflation Reduction Act also provides opportunities to get tax credit when you switch to more energy efficient products – find out how much you can save.
CONTACT EXPERTS
Arene Rushdan
Arizona Faith Network
Cooling Center Organizer
Expertise: extreme heat and health; cooling centers
Contact: jen@hudsonwestpr.com
Yueming 'Lucy' Qiu, PhD
Associate Professor
University of Maryland
Expertise: renewable energy, energy efficiency and insecurity
Contact: yqiu16@umd.edu
FIND EXPERTS
Submit a request to SciLine from the American Association for the Advancement of Science or to the Climate Data Concierge from Columbia University. These free services rapidly connect journalists to relevant scientific experts.
Browse maps of climate experts and services at regional NOAA, USDA, and Department of the Interior offices.
Explore databases such as 500 Women Scientists, BIPOC Climate and Energy Justice PhDs, and Diverse Sources to find and amplify diverse expert voices.
Reach out to your State Climate Office or the nearest Land-Grant University to connect with scientists, educators, and extension staff in your local area.
METHODOLOGY
Annual cooling degree day (CDD) data from 1970-2022 were obtained from the Applied Climate Information System. CDDs were calculated as the sum of the daily cooling degree days each year using a base temperature of 65°F. The change in the number of annual CDDs is based on linear regression. Climate Central's CDD analysis includes 247 stations. Data summaries based on linear trends include 240 total locations due to data gaps in seven stations: Dothan, Ala.; Hattiesburg, Miss.; Hazard, Ky.; Jefferson City, Mo.; Terre Haute, Ind.; Twin Falls, Idaho; and Wheeling, W.Va.