Show Up for Stripes Day on June 21st!
Show Up for Stripes Day on June 21st!
June 21 is the sixth annual #ShowYourStripes Day – a time when meteorologists and other climate communicators around the world raise awareness of our warming planet by displaying these colorful visuals of climate change.
Why June 21? It's the day the summer solstice occurs, and on this start to the season with the biggest extremes (heat, hurricanes, wildfires), Climate Central can help you tell the story of Stripes and advance critical conversations on climate.
Cover the Real-World Impacts of Stripes in Your Community.
These visually powerful tools of climate change communication can help to connect the dots between extreme weather and climate warming in your community. Climate Central’s Climate Matters team makes it possible to access Stripes graphics for nearly 200 cities, 49 states (excluding Hawaii). Find your location:
Want newly updated local Stripes straight to your inbox and not signed up for Climate Matters?
Click here: https://www.climatecentral.org/stripes
Brand New for 2023: Climate Stripes Set to Illuminate the Night!
For the first time ever, landmarks in cities across the U.S. and Canada will light up in honor of #ShowYourStripes Day! Check the list below to find a participating landmark near you. And if you see these LED Stripes, be sure to snap a photo and share on-air and online with the hashtag #ShowYourStripes.
.jpg)
| Landmark | Location | Day of Lighting |
|---|---|---|
| Davenport Skybridge | Davenport, IA | 6/12-18 |
| Lowry Avenue Bridge | Minneapolis | 6/20 |
| I-35W St. Anthony Falls Bridge | Minneapolis | 6/20 |
| Fountain at Alberta Park | Tuscaloosa, AL | 6/20-6/22 |
| Ben Franklin Bridge | Philly | 6/21 |
| Skydance Bridge | Oklahoma City | 6/21 |
| Terminal Tower | Cleveland | 6/21 |
| CN Tower | Toronto | 6/21 |
| Zakim Bridge | Boston | 6/21 |
| Longfellow Bridge | Boston | 6/21 |
| Fore River Bridge | Boston | 6/21 |
| Burns Bridge | Boston | 6/21 |
| Gilbert Water Tower | Gilbert, AZ | 6/21 |
| Twin Arches Bridge | Winston-Salem | 6/21 |
| Dublin Link Bridge | Dublin, OH | 6/21 |
| Retirement Systems of Alabama Tower Complex | Mobile & Montgomery, AL | 6/21 |
Background on Climate Warming Stripes.
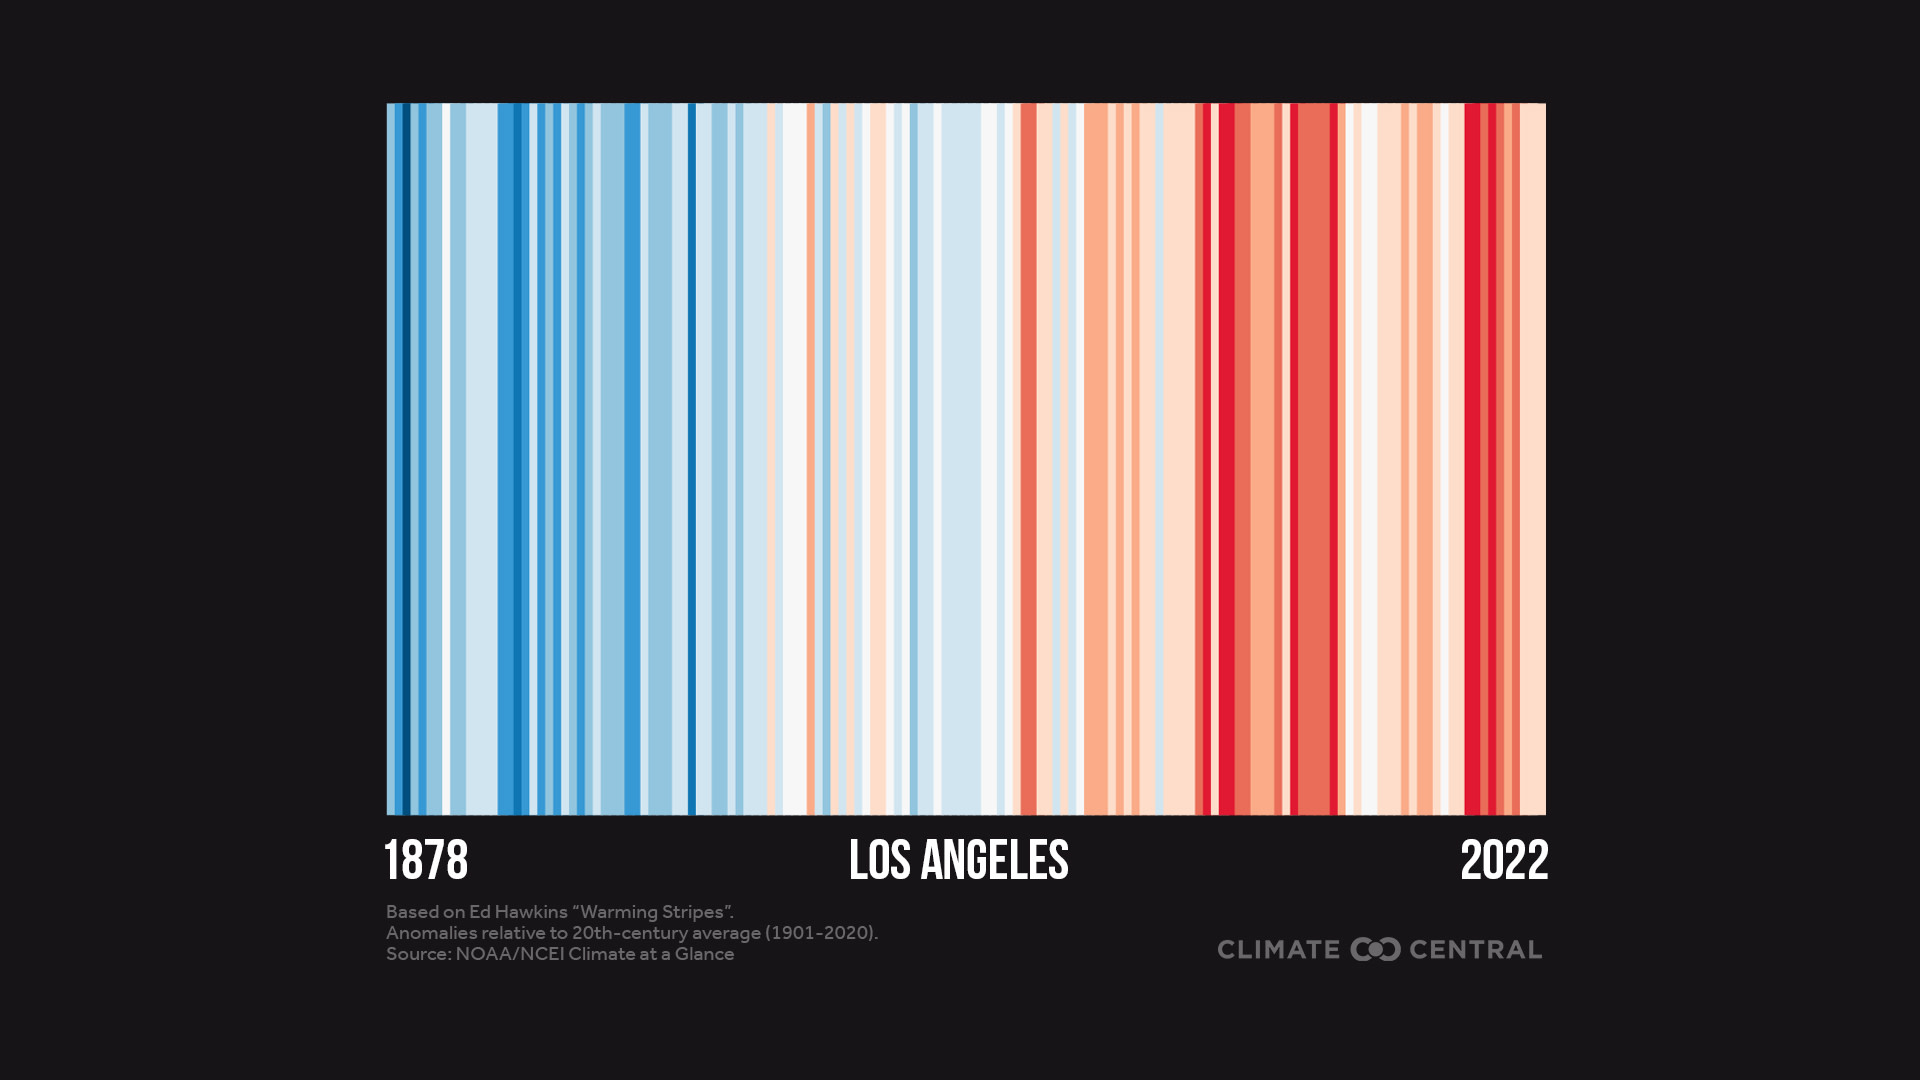
Warming Stripes, created by climate scientist Ed Hawkins, illustrate the rise in global temperatures caused by human activities, particularly the burning of fossil fuels. These visually powerful images represent the change in temperature over the last 100-plus years.
Each stripe represents one year. The color corresponds to whether the temperature was above the long-term average (red) or below (blue). For nearly every city, state and country, the Stripes transition from mainly blue to mainly red, depicting the dramatic rise in average temperatures.
Get Stripes Inspired.
The health of your family, friends and neighbors; the air quality in your community, the wildlife around a popular walking trail, the quality of your city’s drinking water…there are so many reasons to #ShowYourStripes.

Check out these examples of #ShowYourStripes Day coverage:
Climate Central's Bernadette Woods Placky explains the meaning behind the Warming Stripes
A collage of worldwide Stripes coverage from the International Weather and Climate Forum
Doing a story on Stripes? Contact Peter Girard to request an interview with a member of the Climate Central team.
Share Stripes with Your Colleagues and Friends.
Not signed up for Climate Matters? Do so below! And be sure to share this page with colleagues and friends.
For more on the methodology of Warming Stripes: https://www.climatecentral.org/climate-matters/showyourstripes-day-2023