Climate change in Tucson, Arizona
Climate change is affecting locations like Tucson in a variety of ways. In spring, these impacts include heavier rain, more frequent fire weather, and more unusually warm days.
Explore these pages to learn how people in Tucson are at risk in a warming world.
Since 1970, average annual temperatures in Tucson have gotten 5.0°F warmer, reflecting an overall warming trend.
Warming puts people and ecosystems at risk from more frequent and intense extreme weather.
Overall, the contiguous U.S. is about 2.8°F warmer today than in 1970, based on average temperatures.
Data source: NOAA ACIS
Since 1970, Tucson's annual precipitation has decreased by 2.7 inches.
Climate change is supercharging the water cycle and bringing heavier precipitation extremes across the U.S.
For every 1°F of warming, the air can hold 4% more moisture, increasing the chances of heavier downpours that contribute to flash flooding hazards.
Data source: NOAA ACIS
As of October 15, 2026, Tucson has experienced 142 days this year with temperatures made twice as likely by climate change.
This is according to the Climate Shift Index (CSI), which quantifies the influence of human-caused climate change on daily average temperatures. Temperatures on these days had a CSI level 2 or higher, which indicates local temperatures were at least two times more likely due to climate change.
The CSI ranges from -5 to +5. Positive levels indicate temperatures made more likely due to climate change (while negative scores indicate conditions made less likely).
Data source: Climate Shift Index
Tucson's climate threats in include:
Tucson has experienced 27 more extremely hot days (with temperatures above 82.325°F) since 1970.
More frequent and intense extreme heat — the deadliest type of weather in the U.S. — is a direct result of a warming planet.
Extremely hot days are defined as days with maximum temperatures hotter than 95% of local temperatures from 1991-2020.
Data source: NOAA ACIS
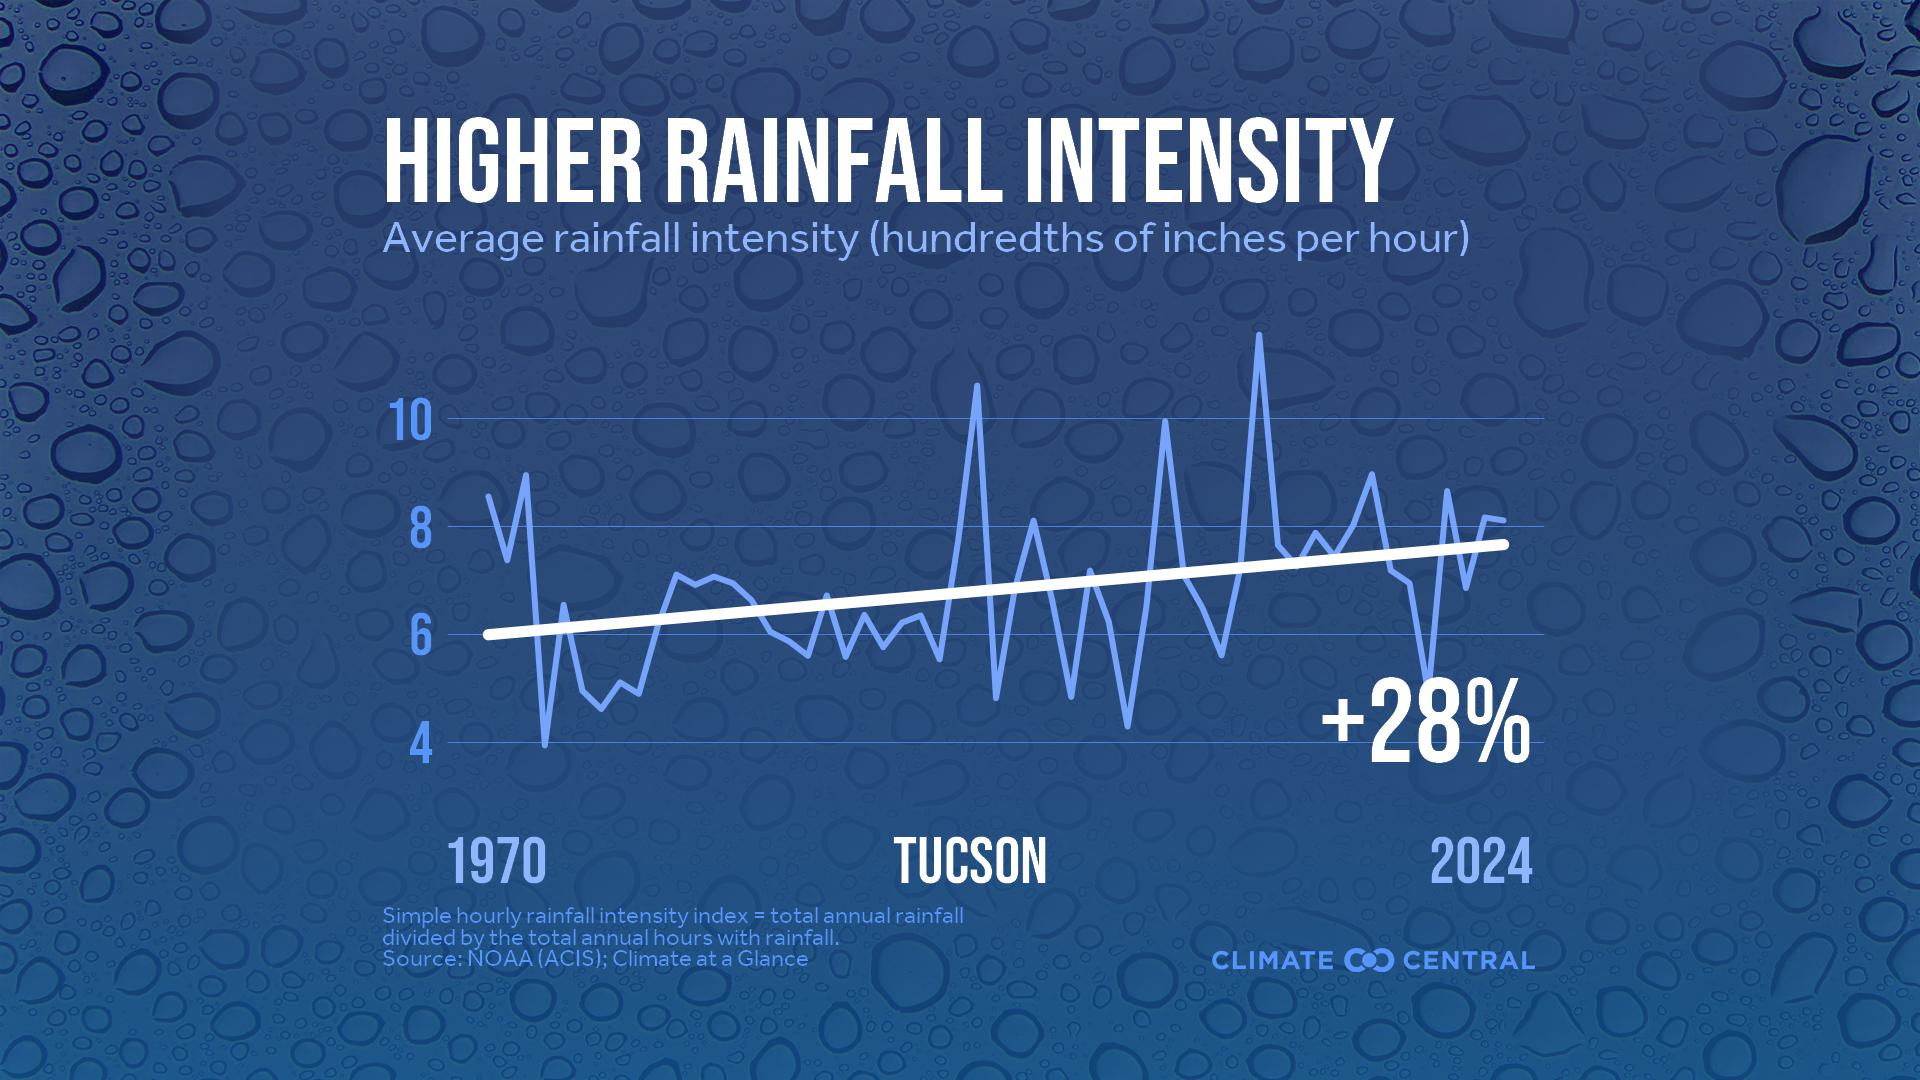
Tucson has experienced a 28% change in hourly rainfall intensity since 1970.
As the climate has warmed over recent decades, the most extreme precipitation days have become more intense across the U.S.
This data uses the simple hourly rainfall intensity index, or the total annual rainfall amount divided by the total hours of rainfall each year (inches per hour). An increase indicates more rain is falling per hour. NOAA’s Rain Rate Visualizer videos show various hourly rainfall rates.
Data source: NOAA ACIS
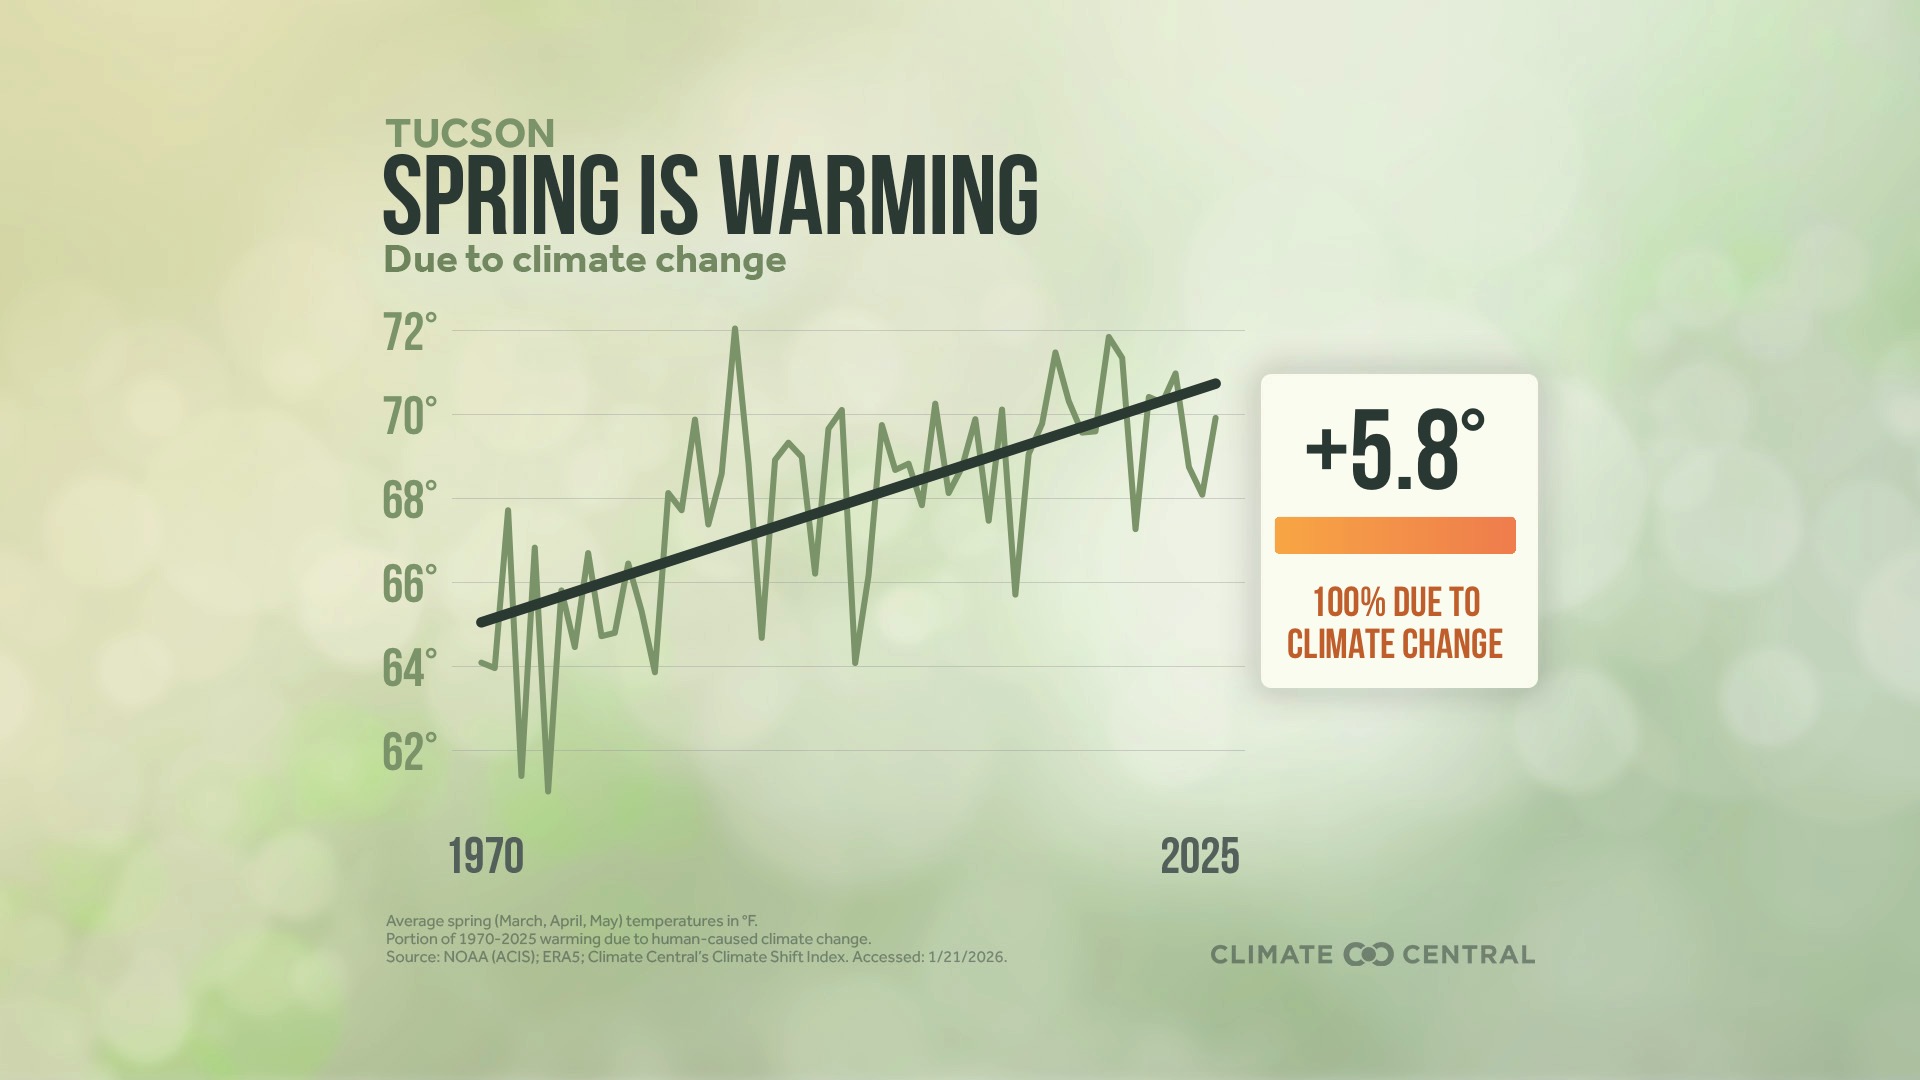
Since 1970, average spring temperatures in Tucson have gotten 6.2°F warmer, reflecting an overall warming trend.
Spring warming affects allergy seasons, disease-carrying pests, and wildfire risk.
Spring is the fastest warming season in Tucson since 1970.
Data source: NOAA ACIS
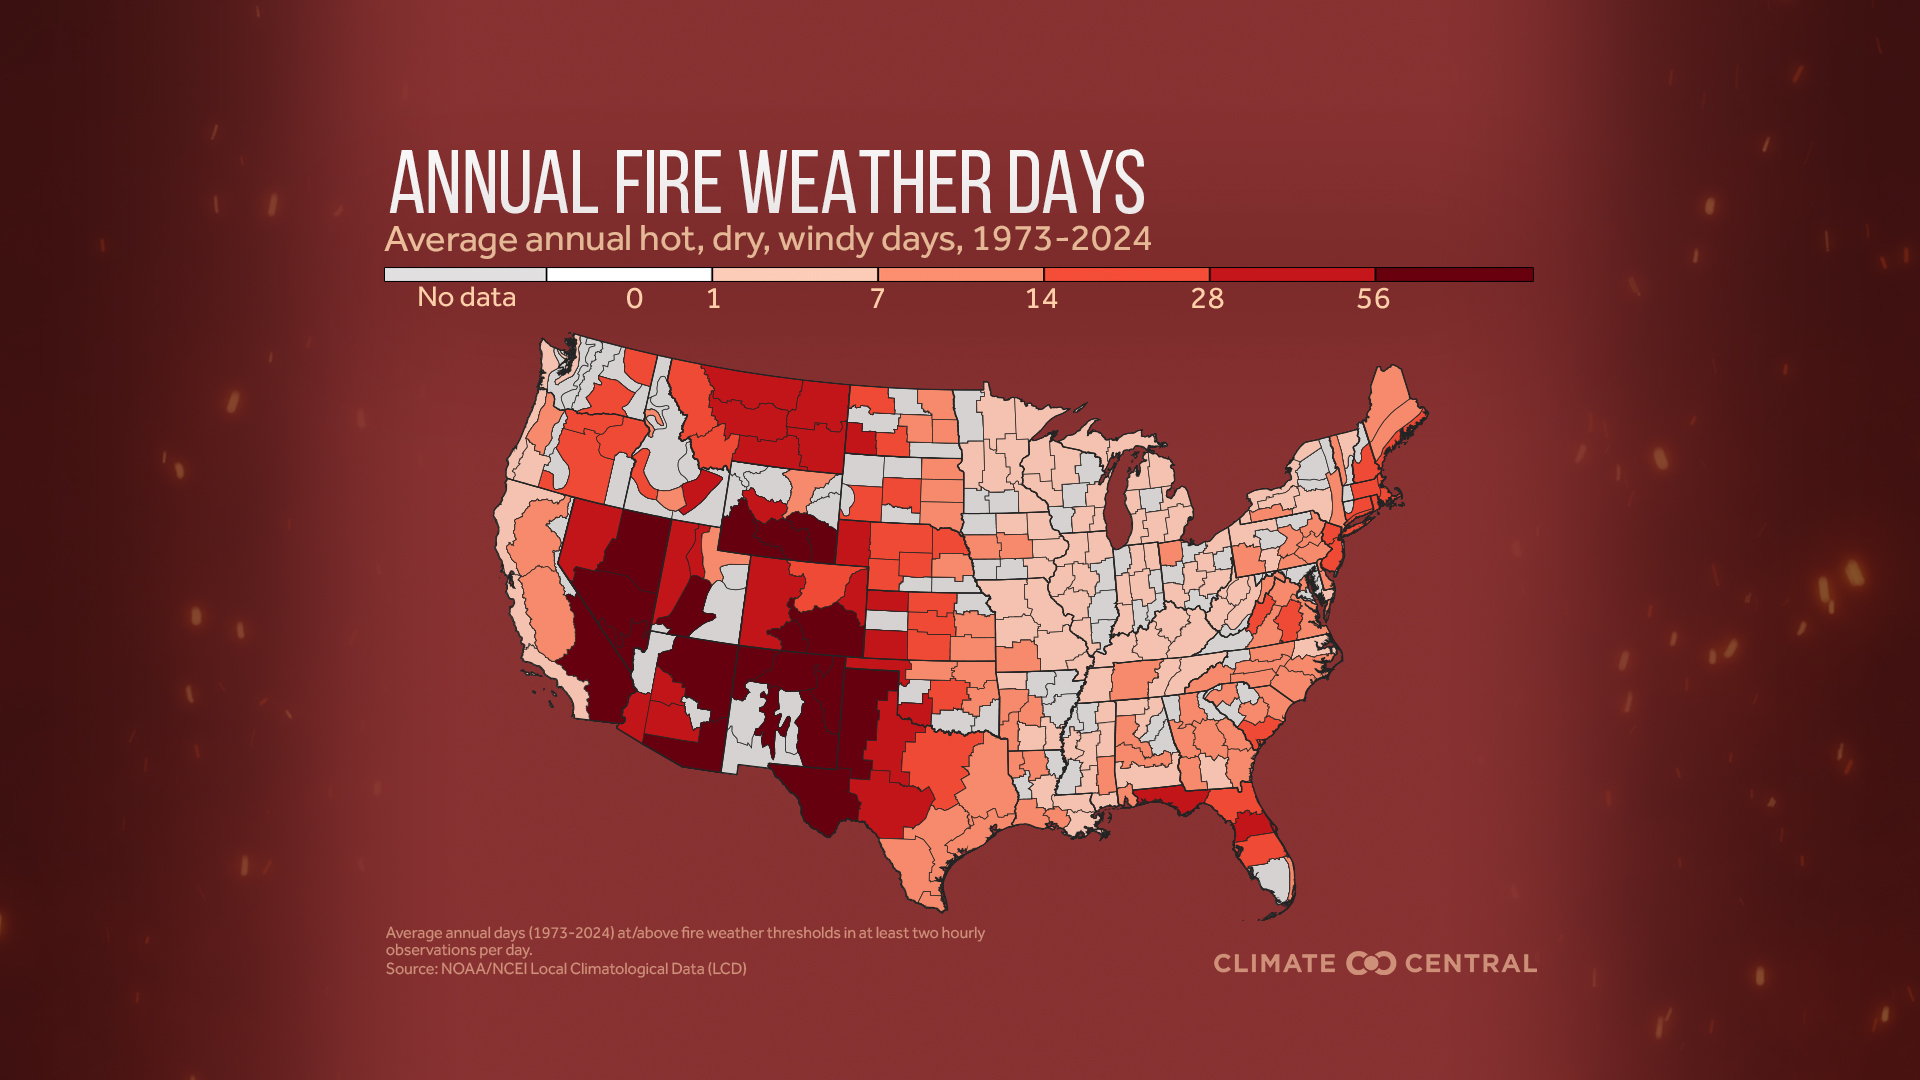
Tucson has experienced 57 more fire weather days since 1973.
Climate change is causing more frequent fire weather — a combination of hot, dry, windy conditions that prime the landscape for wildfires to ignite and spread
Wildfire seasons are lengthening and intensifying, particularly in the western U.S.
Source: NOAA Local Climatological Data
Explore some ways climate change is affecting Tucson in spring
Heavier rainfall rates
Heavier rain threatens people, ecosystems, and infrastructure nationwide.
Key concepts:
- Climate change is supercharging the water cycle, driving heavier rainfall and flood risk.
- 126 U.S. cities (88%) have seen an increase in hourly rainfall intensity since 1970.
- Increases have occurred in every U.S. region but are highest in the Upper Midwest, Northern Rockies & Plains, and Ohio Valley.
- Heavier rain threatens people, ecosystems, and infrastructure nationwide.
More fire weather
Wildfire seasons are lengthening and intensifying.
Key concepts:
- Climate Central analyzed U.S. fire weather (hot, dry, windy conditions) from 1973–2024.
- Wildfire seasons are lengthening and intensifying, especially in the West.
- Fire weather is rising most in spring nationwide
More warm spring days
Spring warming can prolong seasonal allergies, worsen wildfire risk, and limit snow-fed water supplies
Key concepts:
- New Climate Central analysis shows that human-caused climate change is the leading driver of spring warming trends in 98% of 241 major U.S. cities analyzed from 1970-2025.
- Unusually warm spring days now happen more often in nearly every city analyzed.
- Spring has warmed the most across the southern tier of the country, particularly in the Southwest.
- Spring warming can prolong seasonal allergies, worsen wildfire risk, and limit snow-fed water supplies.
More graphics about Tucson and climate change
Browse climate-related graphics for all seasons localized for Tucson, available for download and use consistent with our Terms of use.