'%3e%3cpath%20d='M19.026%2018.7732C17.429%2020.0902%2015.832%2020.8802%2013.57%2020.8802C9.71101%2020.8802%206.783%2017.7202%206.783%2013.6392V13.5072C6.783%209.42616%209.71101%206.26616%2013.57%206.26616C15.566%206.26616%2017.163%206.92416%2019.026%208.50416C20.091%206.92416%2021.555%205.60716%2023.418%204.81716L23.284%204.68616C20.623%202.05316%2017.562%200.868164%2013.57%200.868164C6.25101%200.868164%200.662003%206.26616%200.662003%2013.5082V13.6382C0.662003%2017.0622%201.993%2020.2222%204.255%2022.5922C6.65%2024.9622%209.844%2026.2782%2013.304%2026.2782C17.429%2026.2782%2020.224%2025.0932%2023.018%2022.3282C21.421%2021.4072%2019.958%2020.2222%2019.026%2018.7732ZM40.318%201.00016C36.458%201.00016%2033.132%202.44816%2030.736%204.95016C32.599%205.74016%2034.063%207.05616%2035.128%208.63616C36.325%207.32016%2038.188%206.39816%2040.318%206.39816C44.31%206.39816%2047.37%209.55816%2047.37%2013.6392V13.7712C47.37%2017.8522%2044.31%2020.8812%2040.451%2020.8812C38.321%2020.8812%2036.591%2020.0912%2035.261%2018.6422C34.196%2020.3542%2032.599%2021.6712%2030.736%2022.3292C33.132%2024.6992%2036.458%2026.1472%2040.318%2026.1472C47.636%2026.1472%2053.492%2020.6172%2053.492%2013.5072C53.359%206.39916%2047.77%201.00016%2040.318%201.00016Z'%20fill='%23FBFCFC'/%3e%3cpath%20d='M19.559%2013.6402C19.559%209.55816%2022.885%206.26716%2027.011%206.26716C31.136%206.26716%2034.463%209.55816%2034.463%2013.6402C34.463%2017.7212%2031.136%2021.0132%2027.011%2021.0132C22.885%2021.0132%2019.559%2017.7212%2019.559%2013.6402Z'%20fill='%23FBFCFC'/%3e%3cpath%20d='M27.011%2021.0126C22.885%2021.0126%2019.559%2017.7206%2019.559%2013.6396C19.559%209.5576%2022.885%206.2666%2027.011%206.2666C27.011%206.2666%2023.817%209.8206%2023.817%2013.6396C23.817%2017.4576%2027.011%2021.0126%2027.011%2021.0126Z'%20fill='%23DCDDDE'/%3e%3c/g%3e%3cdefs%3e%3cclipPath%20id='clip0_11268_85798'%3e%3crect%20width='54'%20height='27'%20fill='white'/%3e%3c/clipPath%3e%3c/defs%3e%3c/svg%3e)
Climate change in Hazard, Kentucky
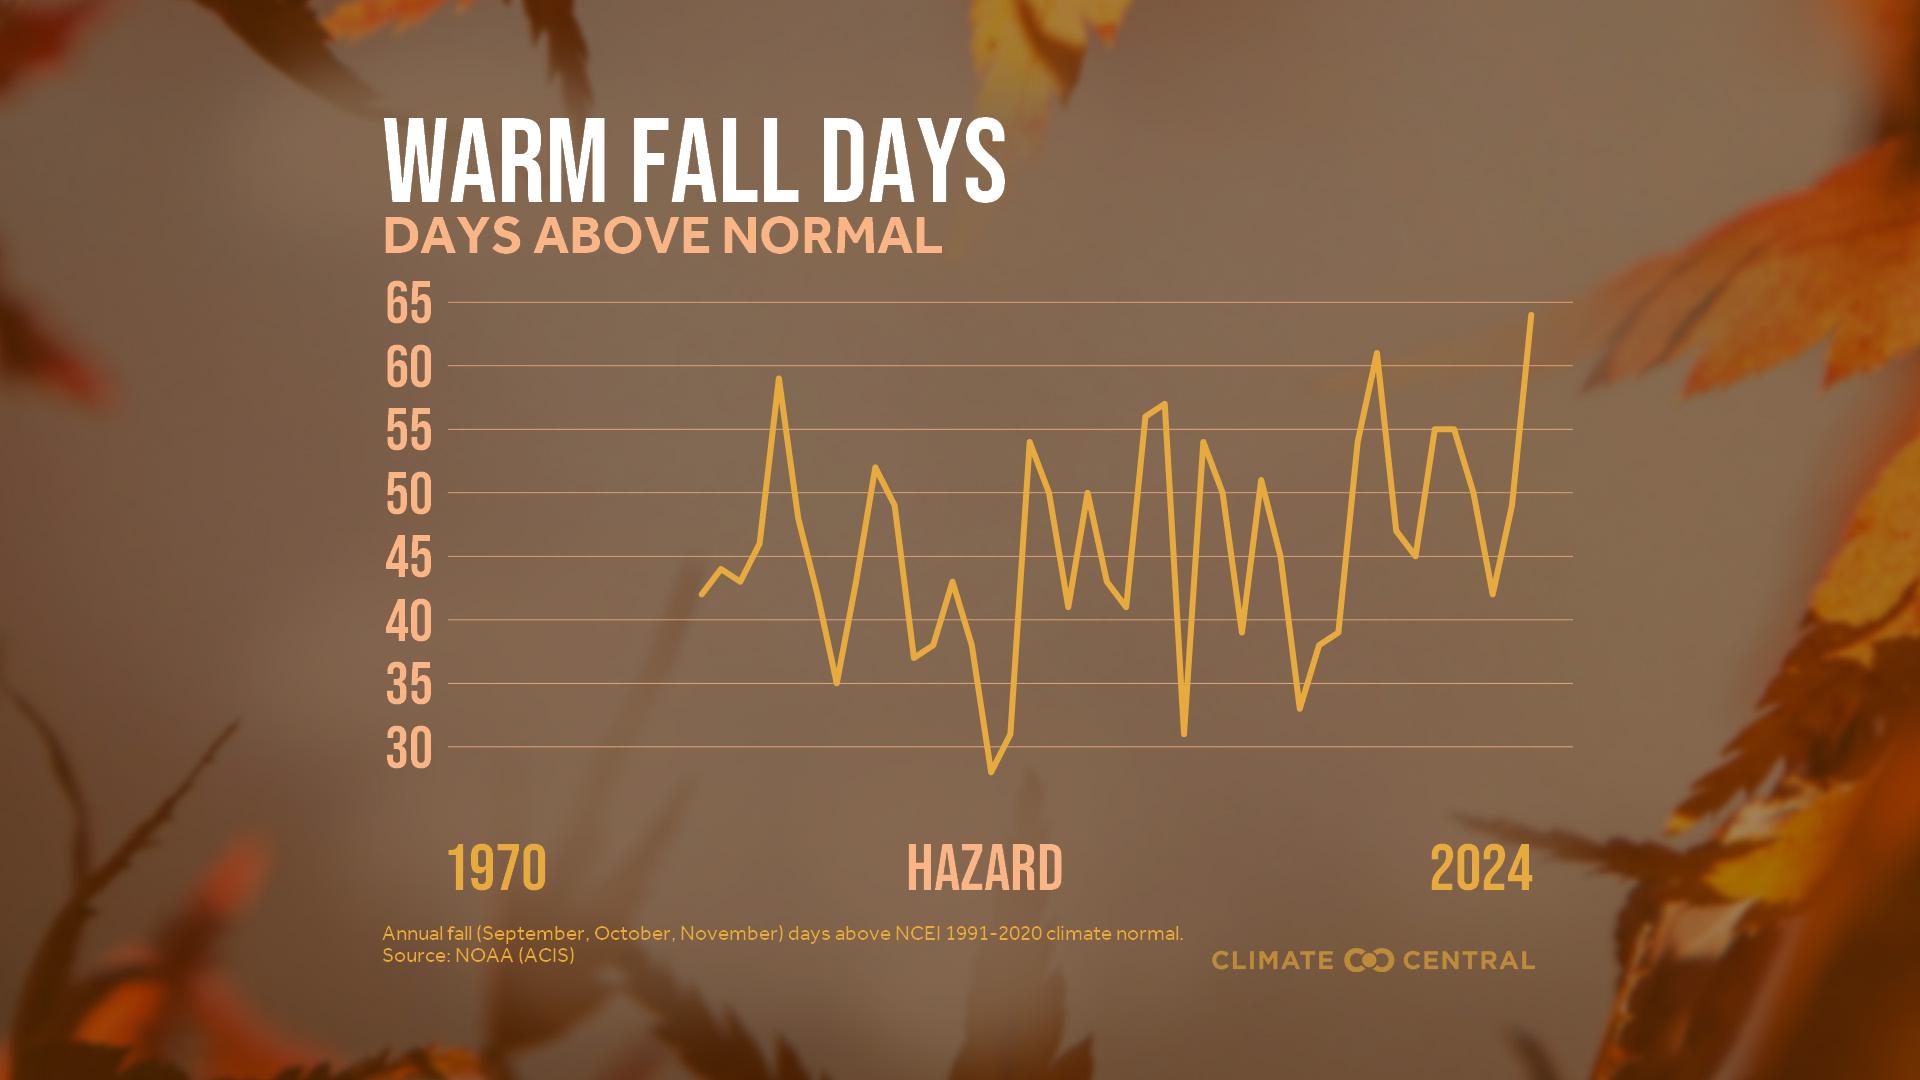
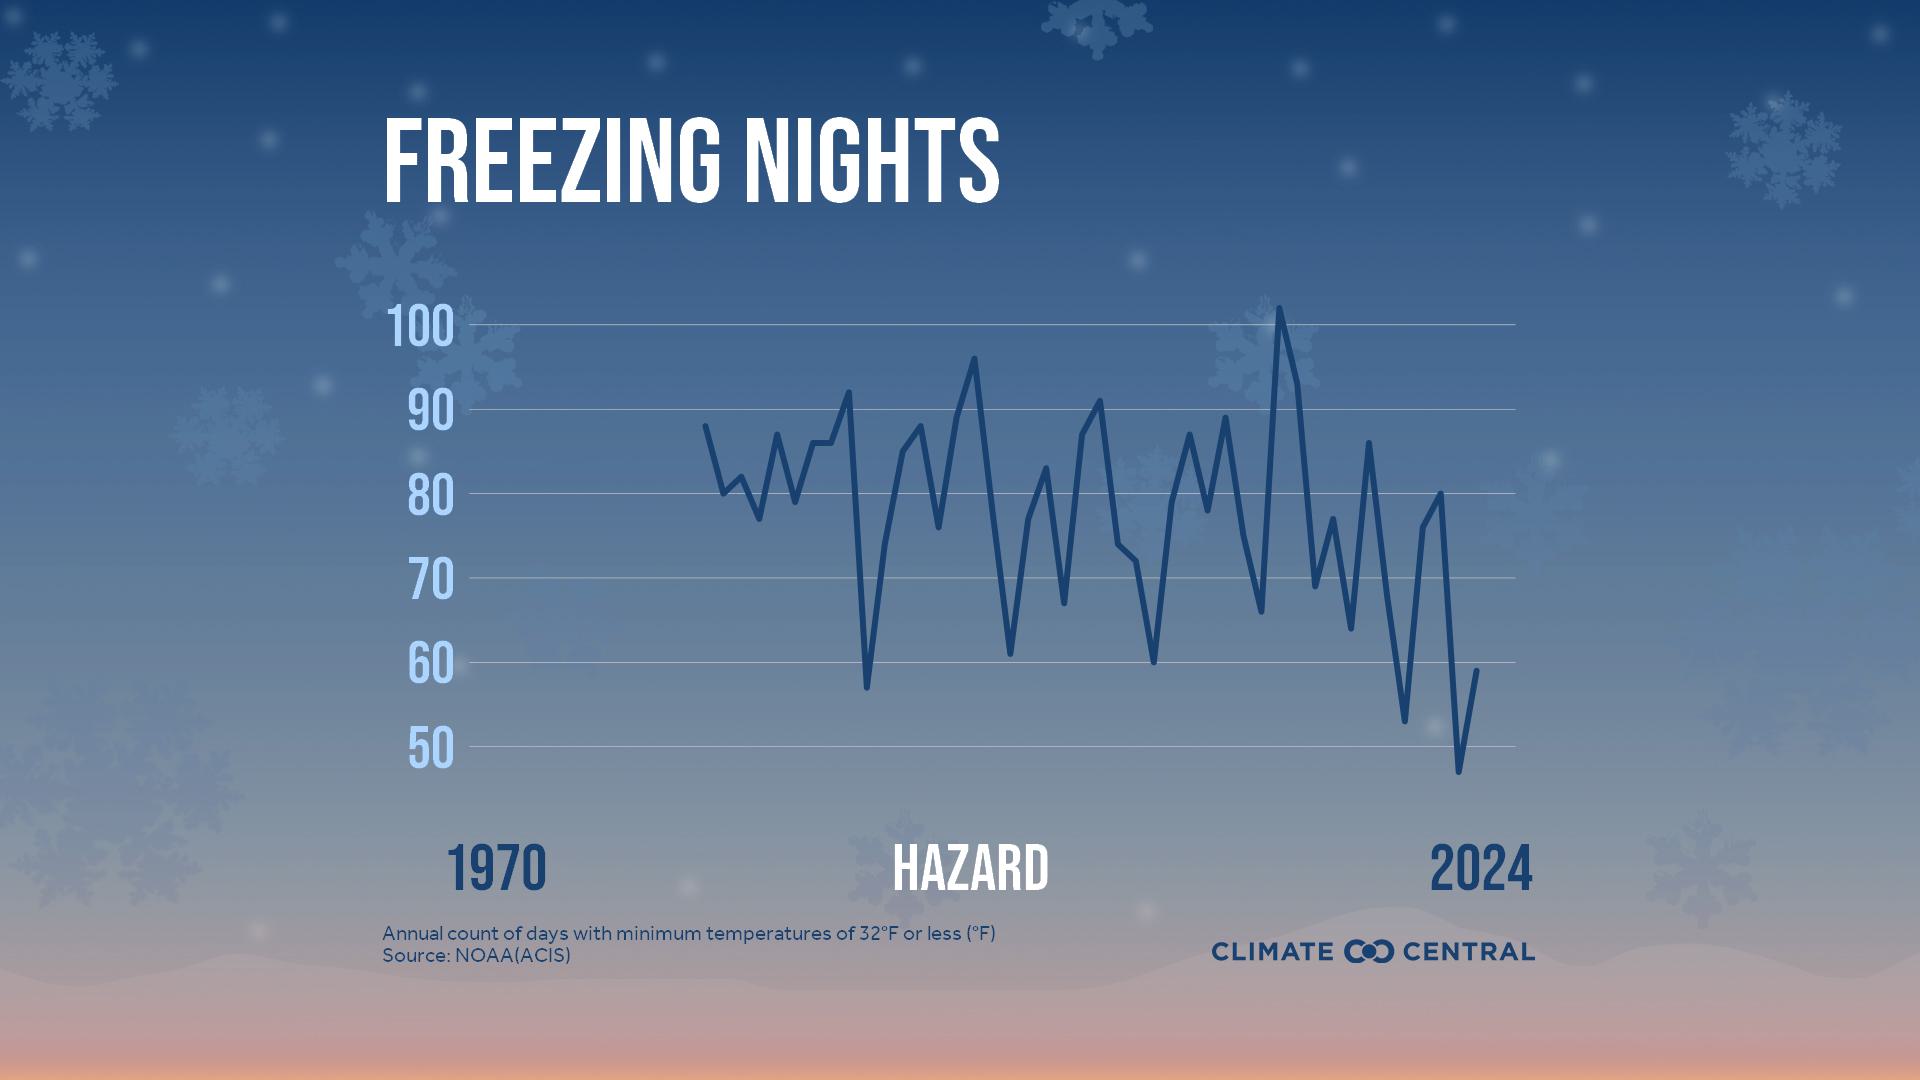
Climate change is affecting locations like Hazard in a variety of ways. In fall, these impacts include more extreme rainfall, more unusually warm days, and fewer freezing nights.
Explore these pages to learn how people in Hazard are at risk in a warming world.
As of October 9, 2026, Hazard has experienced 48 days this year with temperatures made twice as likely by climate change.
This is according to the Climate Shift Index (CSI), which quantifies the influence of human-caused climate change on daily average temperatures. Temperatures on these days had a CSI level 2 or higher, which indicates local temperatures were at least two times more likely due to climate change.
The CSI ranges from -5 to +5. Positive levels indicate temperatures made more likely due to climate change (while negative scores indicate conditions made less likely).
Data source: Climate Shift Index
Hazard's climate threats in include:
During the past 20 years, Kentucky experienced 38 more billion-dollar disasters from severe storms compared to the previous 20 years.
As the planet warms, extreme weather events are becoming more frequent and intense, resulting in devastating losses.
This data shows how the total number of severe storms with at least one billion dollars in damages has changed from 1980-1999 to 2005-2024.
Data source: NCEI U.S. Billion-Dollar Weather and Climate Disasters
The amount of rainfall during the heaviest rain events each year in the Southeast has increased by 37% since 1958.
Climate change is supercharging the water cycle, bringing heavier precipitation extremes across the U.S.
This chart shows how the amount of rainfall during the top 1% heaviest rain events each year in the Southeast increased between 1958 to 2021.
Data source: Fifth National Climate Assessment
Explore some ways climate change is affecting Hazard in fall
Heavier downpours
Climate change is supercharging the water cycle, driving heavier rainfall and flood risk.
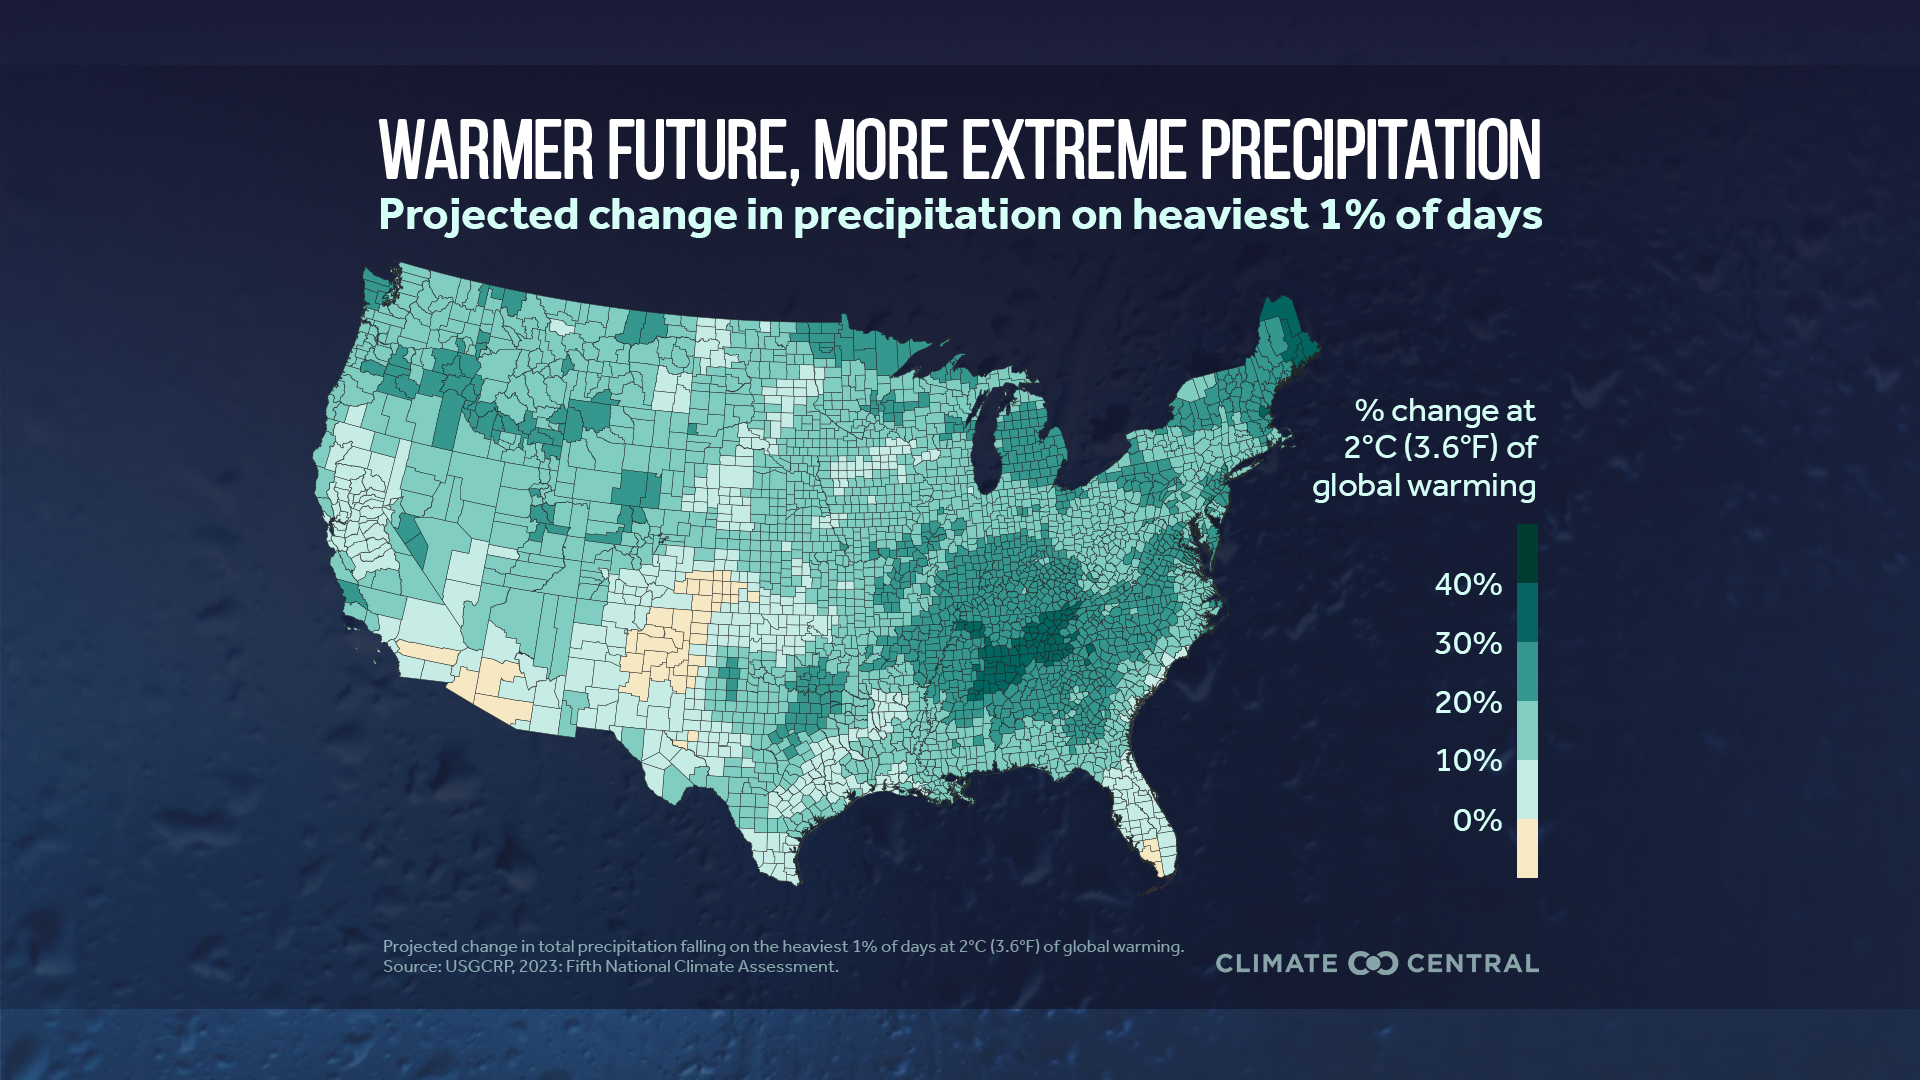
Key concepts:
- Climate change is supercharging the water cycle, driving heavier rainfall and flood risk.
- From 1958–2021, extreme precipitation days grew in every region, led by the Northeast (+60%) and Midwest (+45%).
- Intensification will continue with future warming.
- Short bursts of extreme rain threaten people, ecosystems, and infrastructure nationwide.
More warm fall days
Fall (September-November) has warmed nationwide since 1970.
Key concepts:
- Fall (September - November) has warmed nationwide since 1970.
- Warming is nationwide, strongest in the Southwest.
- Hotter falls extend risks from heat, wildfire, allergies, and more.
Fewer freezing nights
The coldest nights of the year are warming
Key concepts:
- The coldest nights of the year are warming across the U.S.
- 91% of locations analyzed have fewer freezing nights since 1970.
- This is part of a larger trend of especially rapid warming in cool regions and seasons.
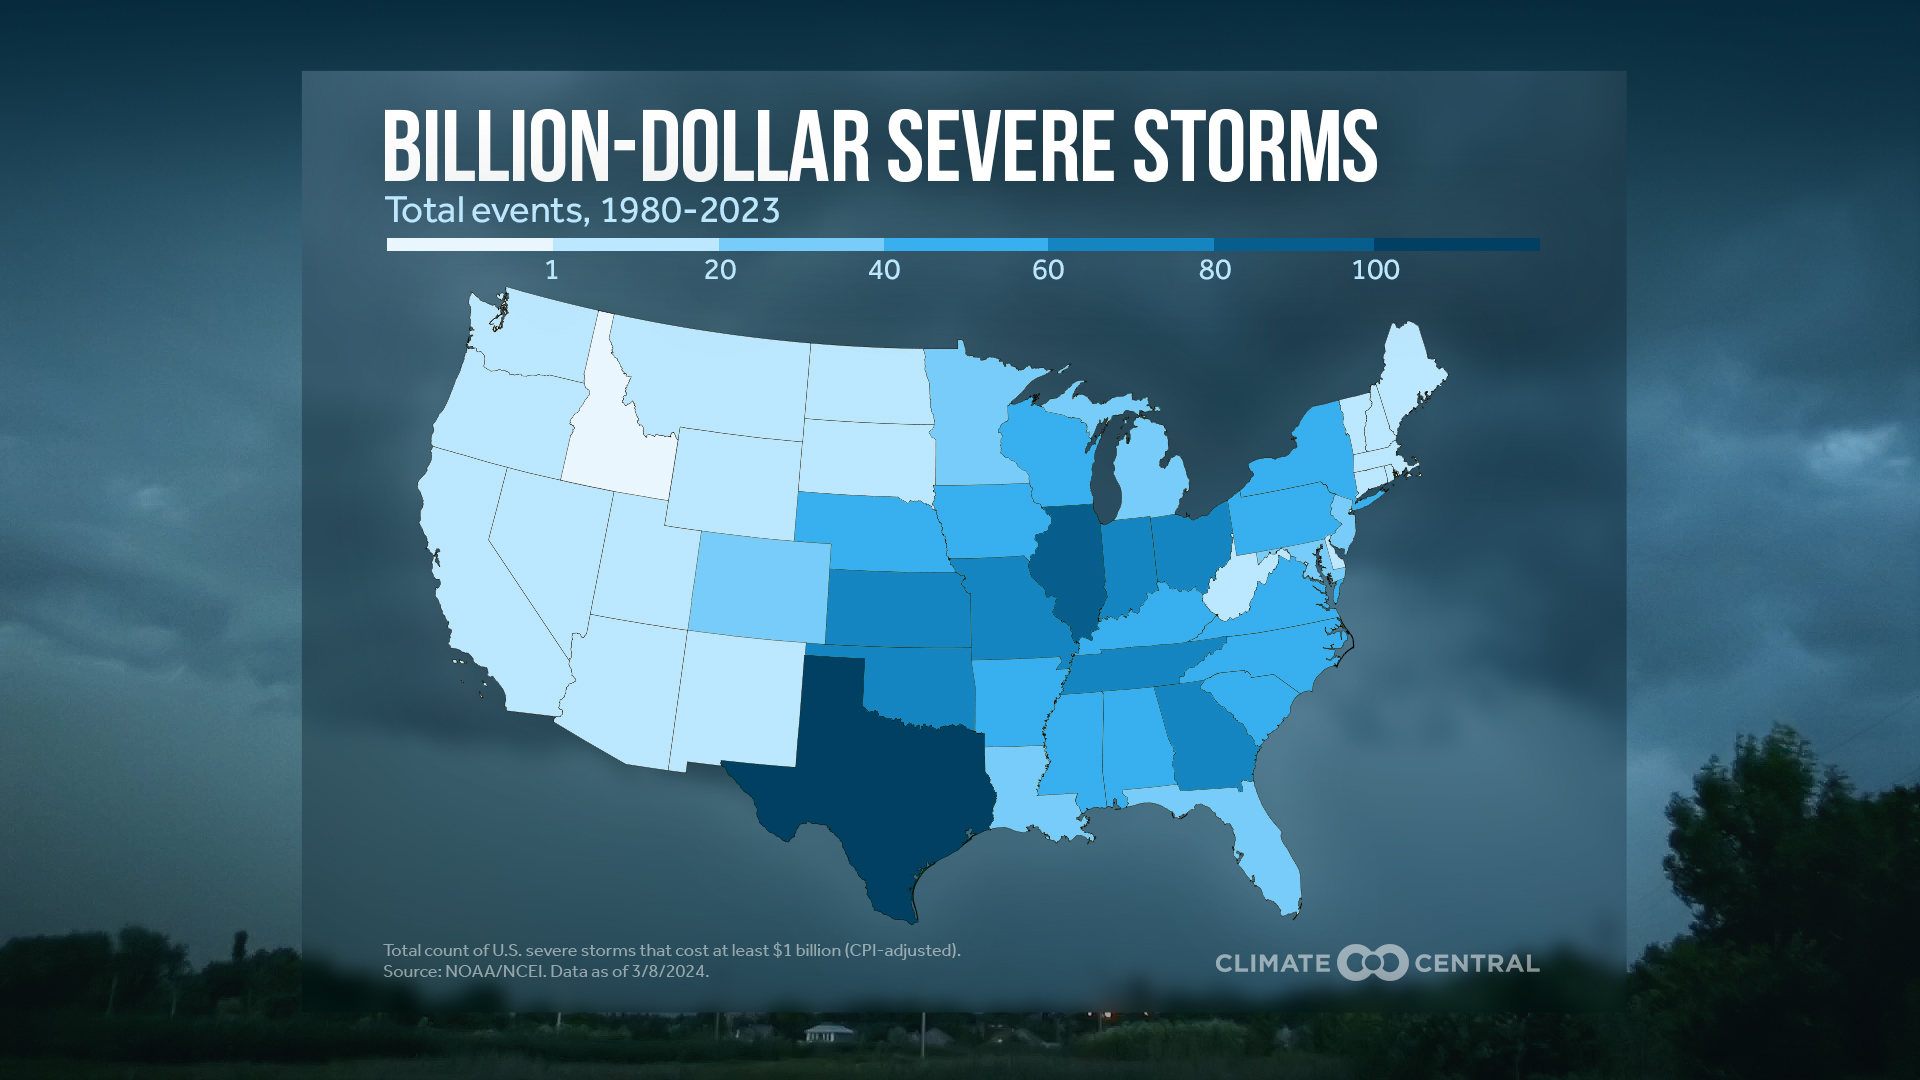
Changes in severe storms
Certain conditions favorable to thunderstorms and tornadoes are occurring more often
Key concepts:
- Severe storms make up half of U.S. billion-dollar disasters since 1980.
- Climate change is shifting storm conditions into new seasons and regions.
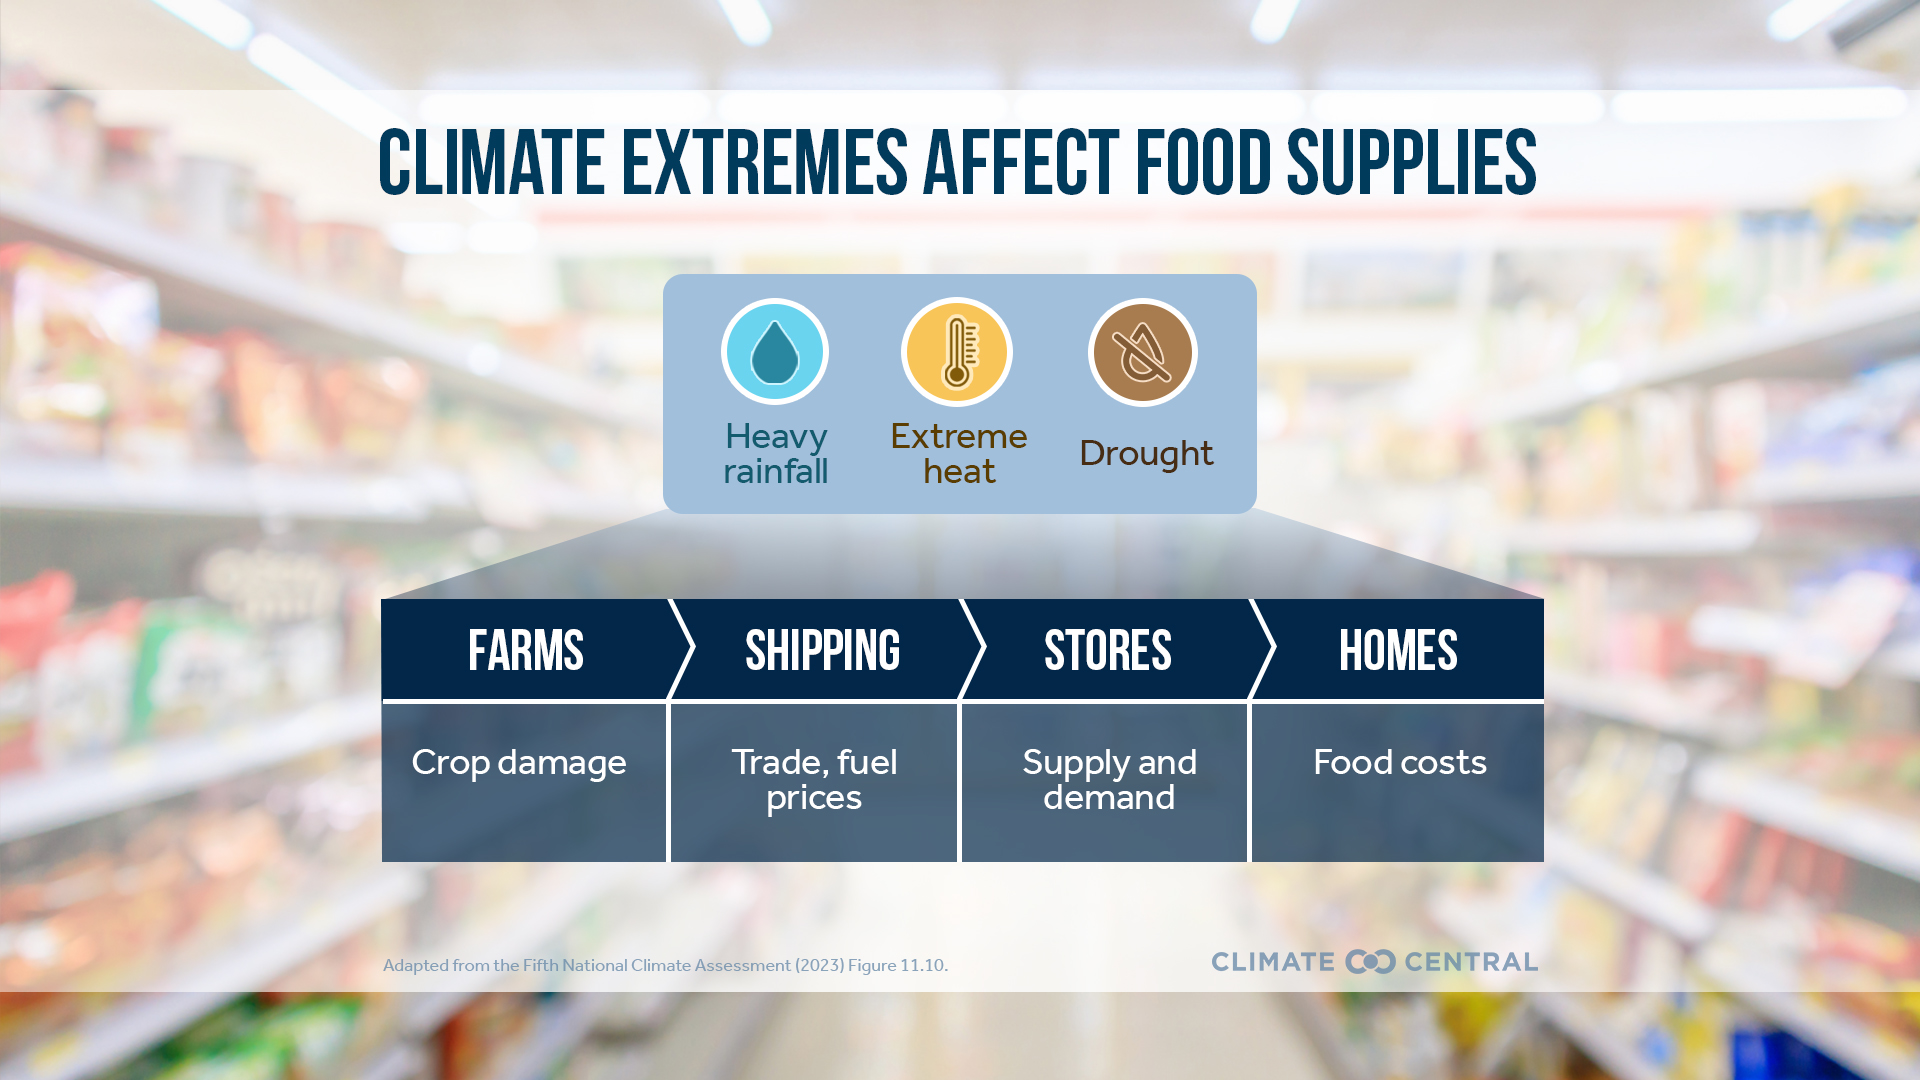
Impacts to food prices
Extreme events fueled by climate change can damage crops, reduce yields, and disrupt supply chains.
Key concepts:
- Food and climate change are closely linked. Food systems account for about one-quarter of all heat-trapping pollution.
- Meanwhile, extreme events fueled by climate change can damage crops, reduce yields, and disrupt supply chains — all of which can drive food prices higher.
- The availability, quality, and affordability of food reflect a complex set of climatic and socioeconomic factors. Emerging research is providing insight into the role of climate change.
More graphics about Hazard and climate change
Browse climate-related graphics for all seasons localized for Hazard, available for download and use consistent with our Terms of use.