
News•December 12, 2014
Trillions and Quadrillions: Numbers Tell U.S. Energy Story
By Bobby Magill
With more stars in the sky than can easily be counted, Carl Sagan, in his book “Billions and Billions,” wrote about how hard it is to talk about the cosmos without using huge numbers.
The same is true for energy consumption and production in the U.S. Daily crude oil production in some states is measured in the millions of barrels. Household energy consumption is measured in millions of British thermal units (Btu). Total nationwide energy production is measured in quadrillions of Btus, or “quads” for short.
The largest energy producing hotspots in the U.S. as of 2012, part of a new U.S. Department of Energy interactive map showing the growth in energy production across the U.S.
Click image to enlarge: Credit: DOE
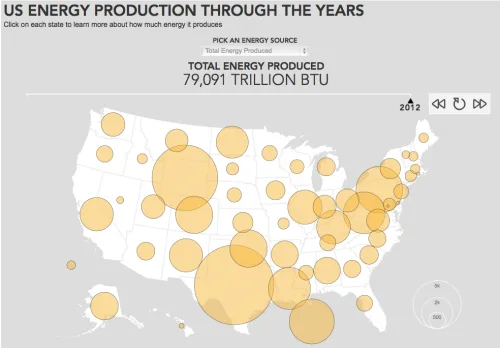
Just as the U.S. Energy Information Administration reported that the crude oil production in the U.S. is expected to continue booming even as oil prices decline, the federal government put out an interactive map showing just how production of energy of all kinds has increased over the past 20 years or so, and where those production hotspots are.
For example, in 2012, the U.S. produced a total of about 79,000 trillion Btu or about 79 quadrillion btu of energy, up from about 68 quadrillion Btu in 1993. By comparison, the average U.S. household burns about 89.6 million Btu of energy each year.
Natural gas, nuclear and biofuels have seen the most production growth in the U.S. since 1993.
Click image to enlarge: Credit: DOE
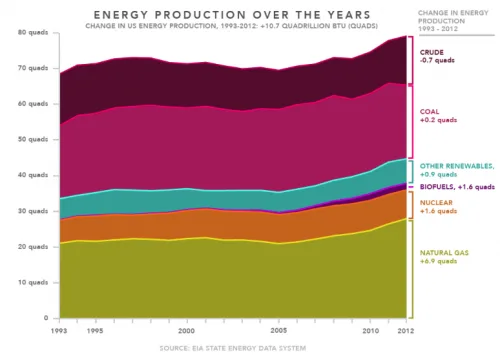
The biggest growth in energy production came from natural gas, which has grown by 6.9 quadrillion Btu since 1993. Biofuels production grew by 1.6 quadrillion Btus from almost nothing two decades ago. And growth in U.S. renewables production, such as wind, solar and hydropower, didn’t quite reach 1 quadrillion Btu between 1993 and 2012.RELATEDLow Oil Prices May Bode Ill For Climate
Derelict Oil Wells May Be Major Methane Emitters
Limiting Methane Leaks Critical to Gas, Climate Benefits
A few other things stand out on the map.
Wyoming, a major coal producer, can be seen exploding onto the energy production scene as a major natural gas and wind power producer. The map shows how Pennsylvania’s natural gas boom made it a major energy producer over the past five years and North Dakota’s Bakken shale boom made that state a major oil producer at the same time.
Most of all, the map shows that, maybe like night sky and the cosmos beyond, “Quadrillions and Quadrillions” may be an apt title for the story of U.S. energy over the past two decades.
You May Also Like:
Storm Pounds Calif., but to the Drought, Just a Spritz
West Coast States Rule Electric Vehicle Adoption in U.S.
Warm Ocean Waters Boosting Typhoons, Record Heat
How Winters Are Changing Throughout the U.S.
Low Oil Prices May Bode Ill For Climate
CO2 Takes Just 10 Years to Reach Planet’s Peak Heat