Climate Matters•March 20, 2024
Warming Climate, More Pollen, Worse Allergies
KEY CONCEPTS
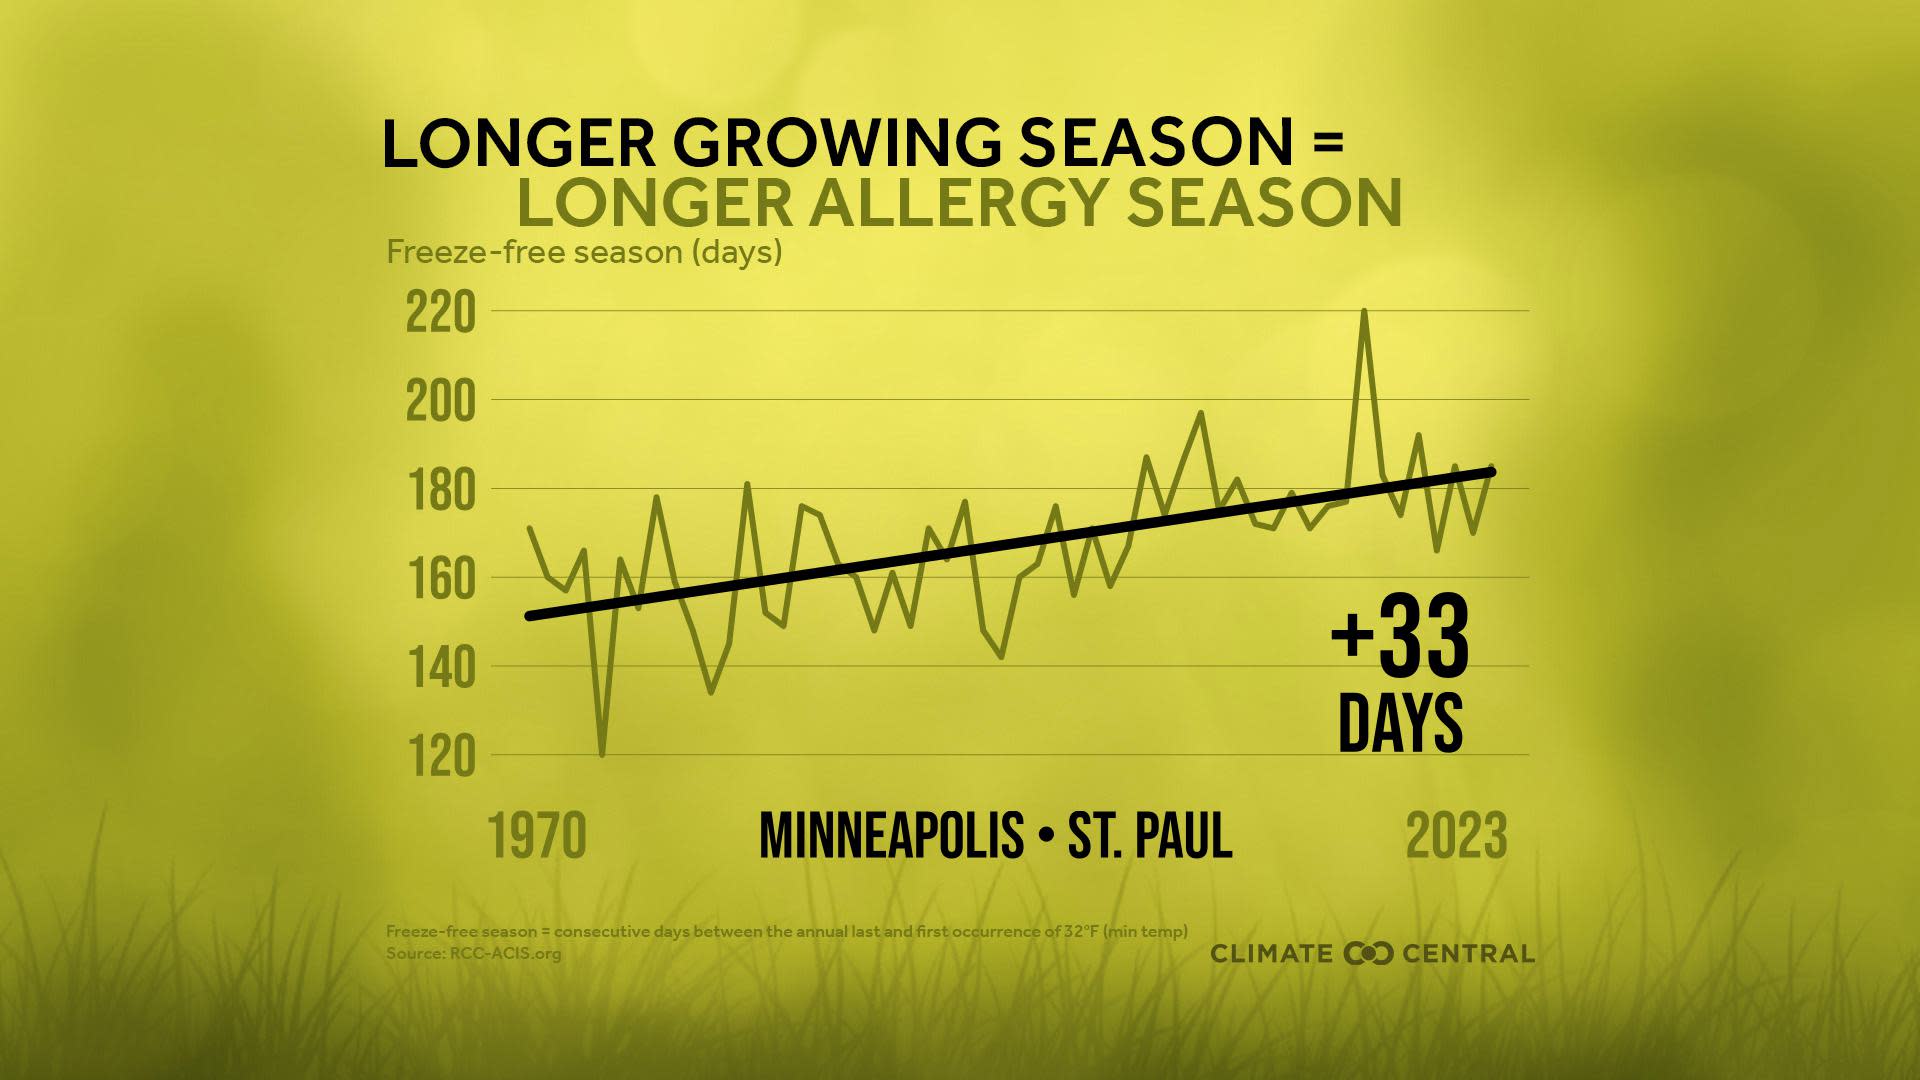
Our warming climate results in more freeze-free days each year — giving plants more time to grow and release allergy-inducing pollen.
The freeze-free growing season lengthened in 83% (164) of 197 U.S. cities analyzed since 1970.
These 164 cities saw their freeze-free season lengthen by 19 days on average.
Climate change contributes to earlier, longer, worse allergy seasons for millions in the U.S. that suffer from seasonal allergies to pollen — including 19% of children.
Climate Central’s fact sheet, Climate Change & Children’s Health: Seasonal Allergies, details how the climate trends that are worsening allergy season affect children’s health and well-being.
Download data: Freeze-free growing season trends
Warming climate, longer pollen season, worse allergies
The first leaves and blooms of spring are arriving days to weeks early in large parts of the southern and central U.S., according to the USA National Phenology Network.
That’s bad news for people with seasonal allergies — about one-quarter of adults and one-in-five children in the U.S.
Earlier springs, longer pollen seasons, and worse seasonal allergies are all linked to our warming climate.
Climate Central’s report Seasonal Allergies: Pollen and Mold reviews weather and climate trends that affect pollen seasons and the related health risks.
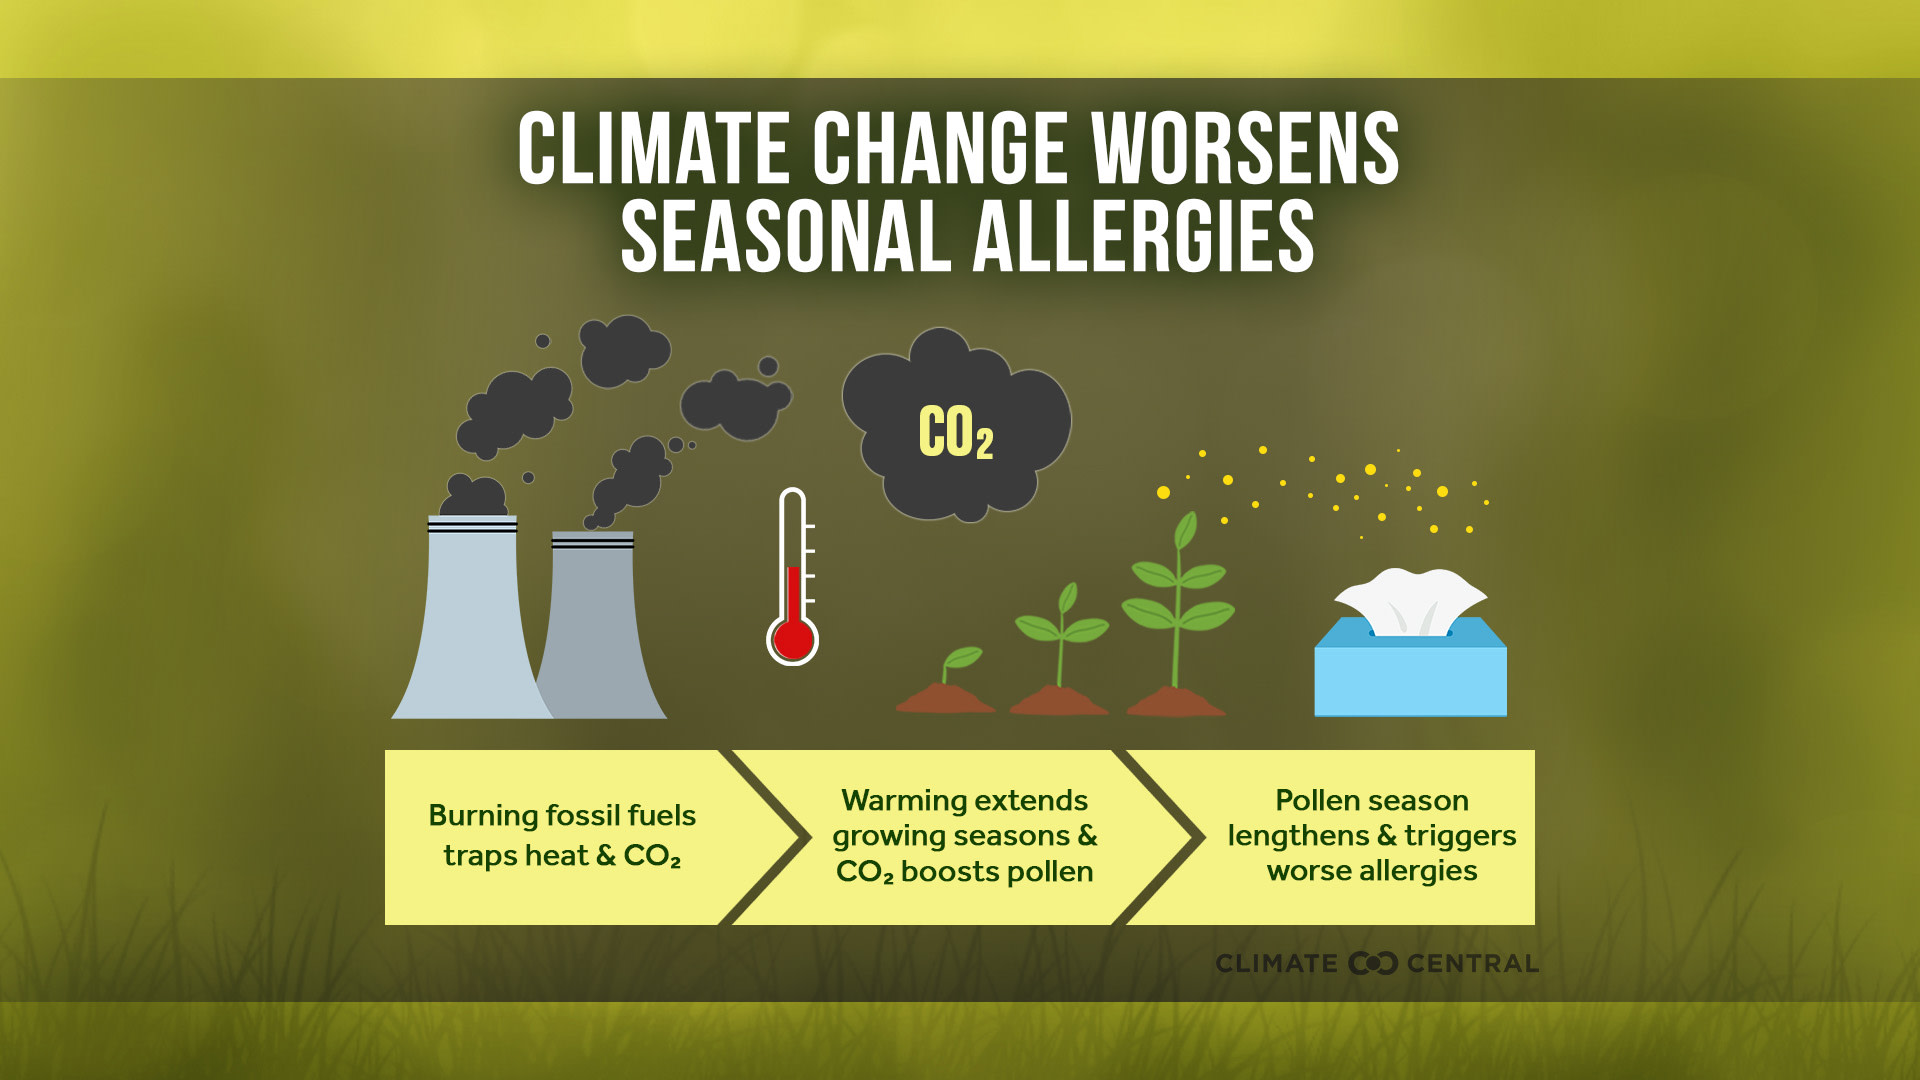
Carbon pollution (primarily from burning coal, oil, and natural gas) traps heat in the atmosphere and contributes to spring warming trends across the U.S.
Warmer, earlier spring means a longer growing season — giving plants more time to grow and release allergy-inducing pollen earlier in spring and later into fall.
Higher levels of CO2 in the air can also boost pollen production in plants, particularly in grasses and ragweed. With continued high rates of CO2 pollution, the U.S. could face up to a 200% increase in pollen production by the end of this century, according to a recent study.
As a result of CO2 buildup and warming, allergy season now arrives earlier in the spring and lasts later into the fall. A recent study found that human-caused warming was a primary driver of North American pollen seasons lengthening (by 20 days on average) from 1990 to 2018.
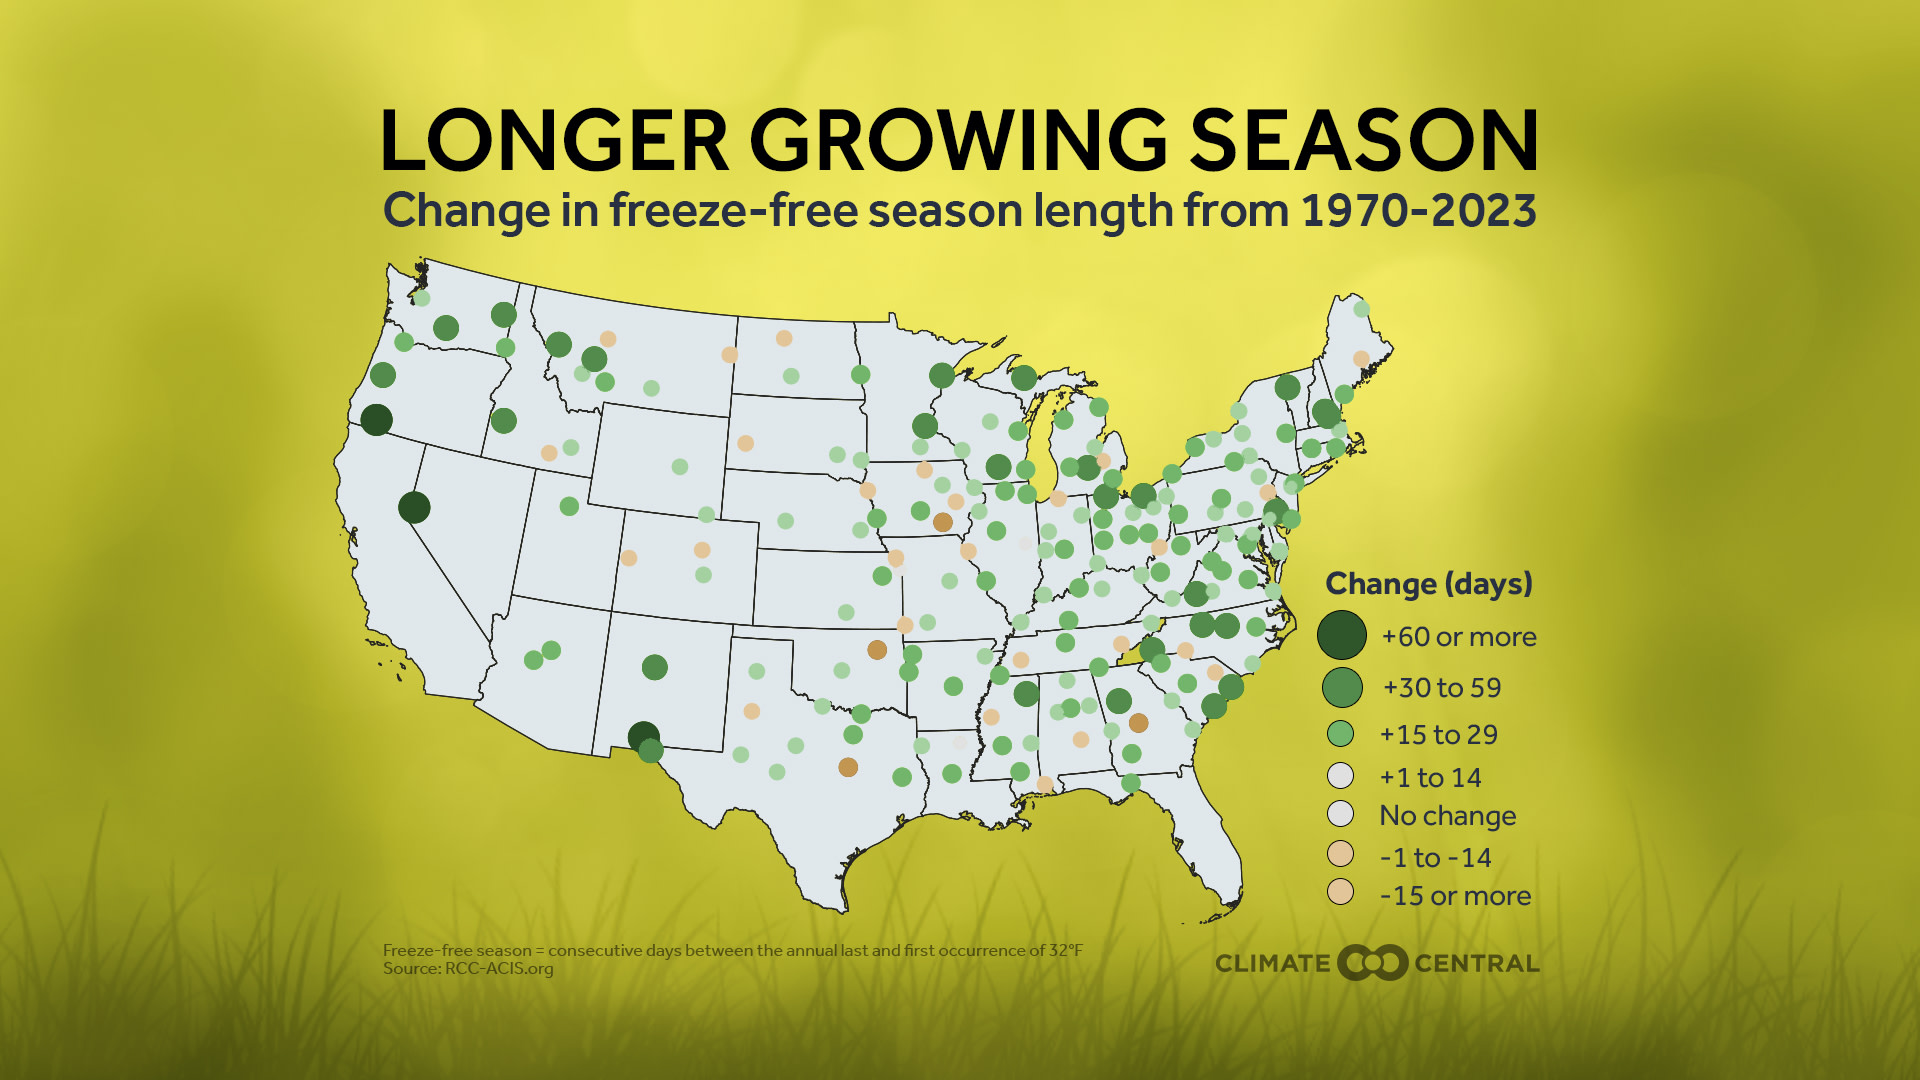
Longer growing season across the U.S.
Climate Central assessed temperature trends in 197 U.S. cities to see how freeze-free season length has changed from 1970 through 2023 (see Methodology).
The freeze-free season lengthened in 83% (164) of the 197 cities analyzed since 1970.
These 164 cities saw their freeze-free season lengthen by 19 days on average.
In 60 cities, the season between the last and first freeze grew by at least three weeks.
The freeze-free growing season increased the most in: Reno, Nev. (95 more days); Las Cruces, N.M. (65 more days); Medford, Ore. (61 more days); Boise, Idaho (51 more days); and Tupelo, Miss. (50 more days).
All nine major U.S. climate regions have seen their freeze-free growing seasons lengthen by at least 11 days on average since 1970.
Among regions, the freeze-free season lengthened by more than two weeks on average in: the Northwest (26 more days); the Southeast and Northeast (15 more days, respectively); and the Upper Midwest (14 more days).
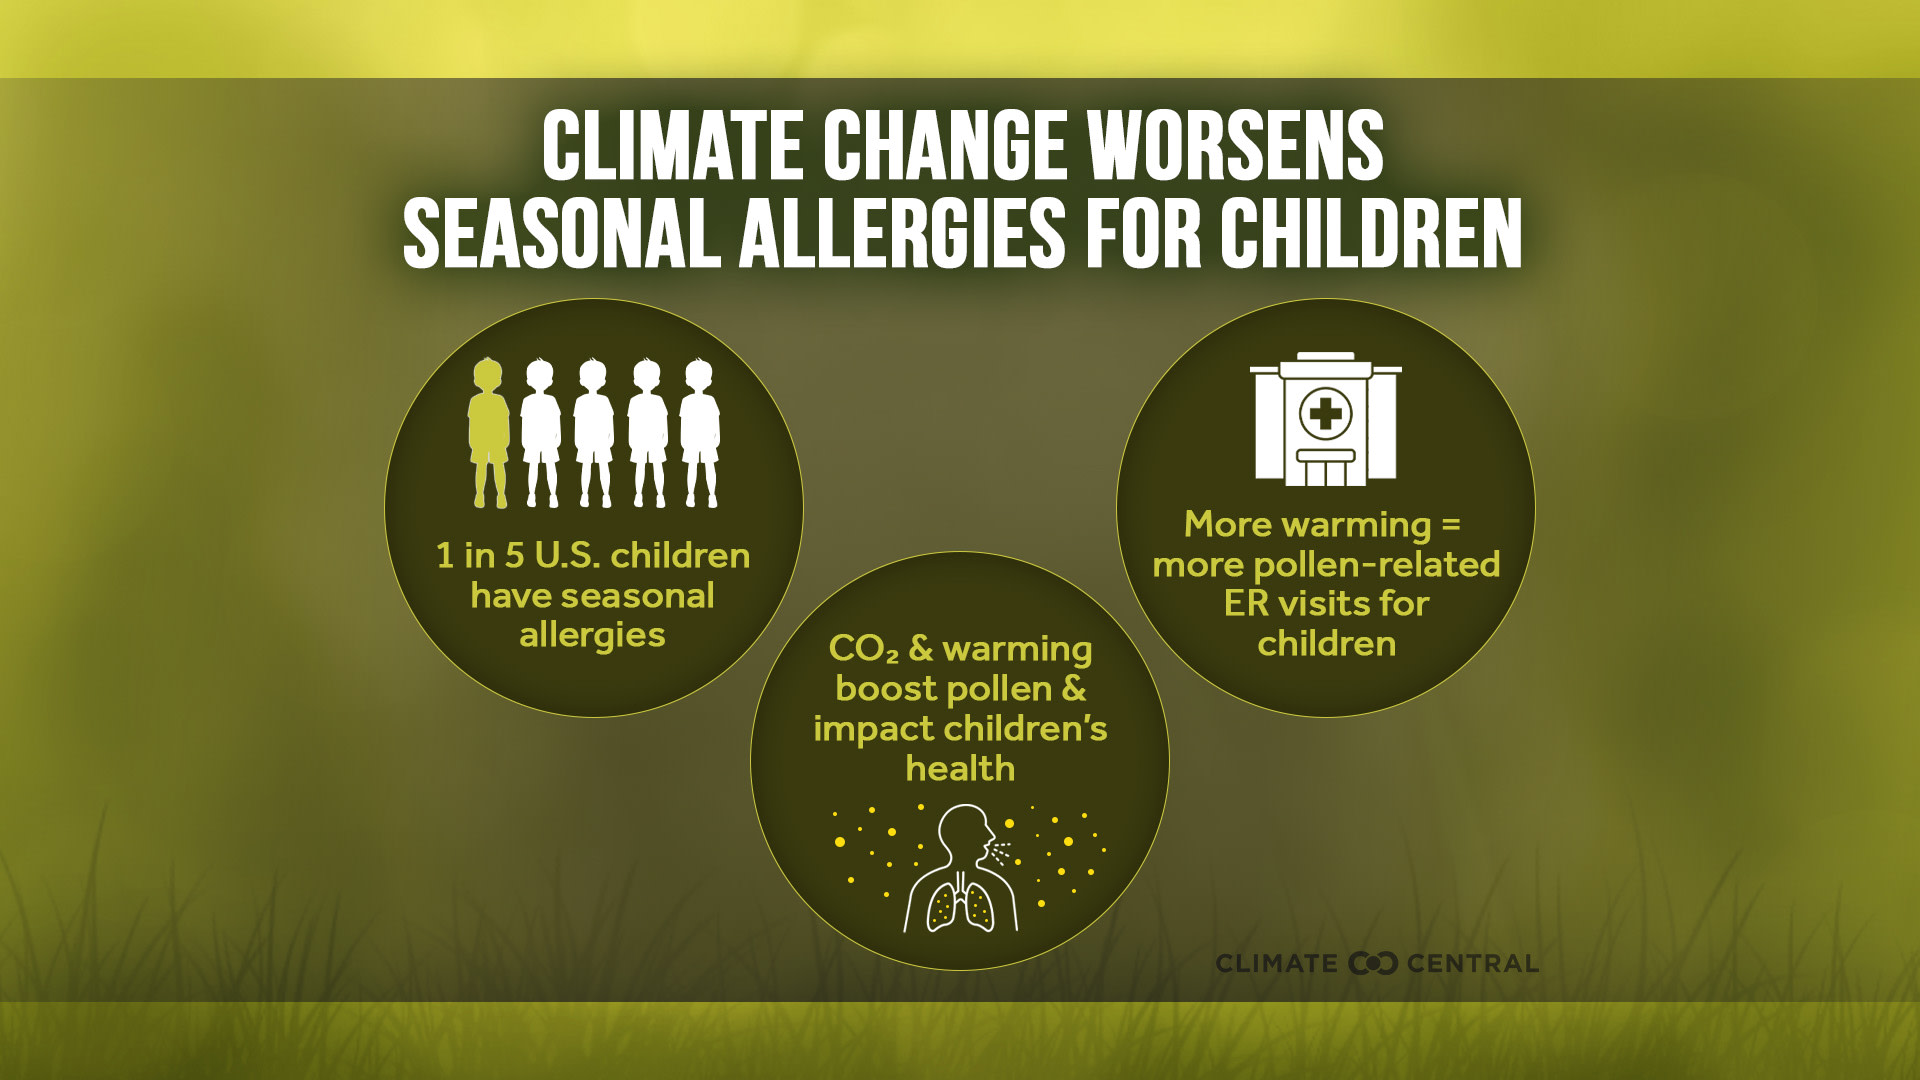
Effects of longer, worse pollen season on children
Longer and more intense pollen seasons can have serious consequences for people with respiratory illnesses like asthma — particularly for children.
Climate Central’s fact sheet, Climate Change & Children’s Health: Seasonal Allergies, details how the climate trends that are worsening allergy season affect children’s health and well-being.
Around 19% of children in the U.S. suffer from seasonal allergies, with symptoms that include sneezing, coughing, itchy or watery eyes, and runny noses.
Pollen is also a trigger for asthma, which affects 6.5% of children in the U.S. According to the Asthma and Allergy Foundation of America, allergic asthma is the most common type of asthma, and is most prevalent in early childhood.
Seasonal allergies and asthma can also affect children’s quality of life including school performance, mood, and sleep in adolescents aged 10-19 years.
Not only do children experience the current effects of climate change on allergies, but younger generations will experience more warming over their lifetimes if carbon pollution continues.
Continued warming could further worsen allergies for children, according to analysis from the U.S. EPA. The analysis found that 2°C (3.6°F) of warming could result in a 17% annual increase in asthma-related emergency room visits among children due to pollen exposure, relative to baseline conditions (1986-2005). Projected increases were largest in Indiana, Kentucky, Ohio, Vermont, and West Virginia.
The same U.S. EPA analysis also found that oak pollen exposure disproportionately impacts Hispanic, Asian, and Black children, as well as low-income, limited English-speaking, and uninsured children.
According to the Asthma and Allergy Foundation of America, Black and Puerto Rican children are between two and three times more likely to have asthma than white children, and therefore more at risk for allergic asthma.
Protecting children’s health
Parents and caregivers can protect children’s health, now and in the future, by minimizing the harmful effects of seasonal allergies in a changing climate. A few key ways:
Respond to symptoms, not the season. Children with allergies may experience symptoms earlier or later than usual as growing seasons expand and shift.
Minimize exposure. Check local air quality reports and allergen forecasts before heading outside. When pollen concentrations are high, consider limiting time outdoors for children with allergies or asthma.
Make the indoors safer and more comfortable. Close windows and doors to minimize aeroallergens inside. Use high-efficiency particulate air (HEPA) filters in living spaces and bedrooms to clean the air.
Commit to rapid, sustained cuts to carbon pollution from burning fossil fuels. Because higher levels of CO2 increase pollen production, reducing carbon pollution will bring more and sooner benefits to allergy sufferers of all ages.
LOCAL STORY ANGLES
Find local pollen and mold counts.
There are pollen and mold spore monitoring stations across the U.S. Local allergen counts and forecasts can be found through resources such as the National Allergy Bureau. State or tribal agencies for environmental protection or public health may also have relevant air quality reports.
See where your city ranks.
The severity of the allergy season varies across the country. The Asthma and Allergy Foundation of America (AAFA) releases an annual report on the Allergy Capitals in the U.S., ranking cities based on pollen scores, over-the-counter medicine use, and the availability of board-certified allergists. Check out how your city ranked on AAFA’s Allergy Capitals list in 2023; the 2024 report will be released soon. The AAFA’s annual Asthma Capitals report also ranks U.S. cities where it’s most challenging to live with asthma.
CONTACT EXPERTS
Lisa Patel, MD
Clinical Associate Professor of Pediatrics and Pediatrician at Stanford Medicine Children’s Health
Executive Director, Medical Society Consortium on Climate and Health
Related expertise: children's health and climate change
Media contact: media@stanfordchildrens.org
Susan Anenberg, PhD
Professor and Chair, Environmental and Occupational Health Department
George Washington University
Related expertise: climate change and health, air pollution
Media contact: Kathleen Fackelmann (kfackelmann@email.gwu.edu)
Lauren Gentile, PhD
Geographer
Environmental Protection Agency’s Climate Change Division
Relevant expertise: seasonal changes
Media contact: Shayla Powell (powell.shayla@epa.gov)
FIND EXPERTS
Submit a request to SciLine from the American Association for the Advancement of Science or to the Climate Data Concierge from Columbia University. These free services rapidly connect journalists to relevant scientific experts.
Browse maps of climate experts and services at regional NOAA, USDA, and Department of the Interior offices.
Explore databases such as 500 Women Scientists, BIPOC Climate and Energy Justice PhDs, and Diverse Sources to find and amplify diverse expert voices.
Reach out to your State Climate Office or the nearest Land-Grant University to connect with scientists, educators, and extension staff in your local area.
METHODOLOGY
Daily minimum temperature data from 1970-2023 were obtained from the Applied Climate Information System. The length of the annual freeze-free season was determined based on the annual count of consecutive days with minimum temperatures above 32°F, i.e., the time between the last day below 32°F (January through July) and the first day below 32°F (July through December). Years with freeze-free seasons of less than two weeks (e.g., beginning June 30, ending July 3) were dropped from the analysis. This condition affected several years in Bend, Ore. and Butte, Mont.
Of 247 total stations assessed, 44 had an average growing season length of less than three months or a year-round lack of sustained freeze and were therefore excluded from this analysis. Reported long-term (1970-2023) trends in freeze-free season length are based on linear regression. Summary statistics were reported for 197 of the 203 remaining stations due to data completeness issues for six stations: Bend, Ore.; Dothan, Ala.; Hazard, Ky.; Jefferson City, Mo; Twin Falls, Idaho; and Wheeling, W.Va.