Climate Matters•January 10, 2023
2022 U.S. Temperatures and Billion-Dollar Disasters
KEY CONCEPTS
2022 was the 18th hottest year on record for the U.S., according to NOAA.
Temperatures in 2022 are a snapshot of a longer warming trend across the U.S. and the globe.
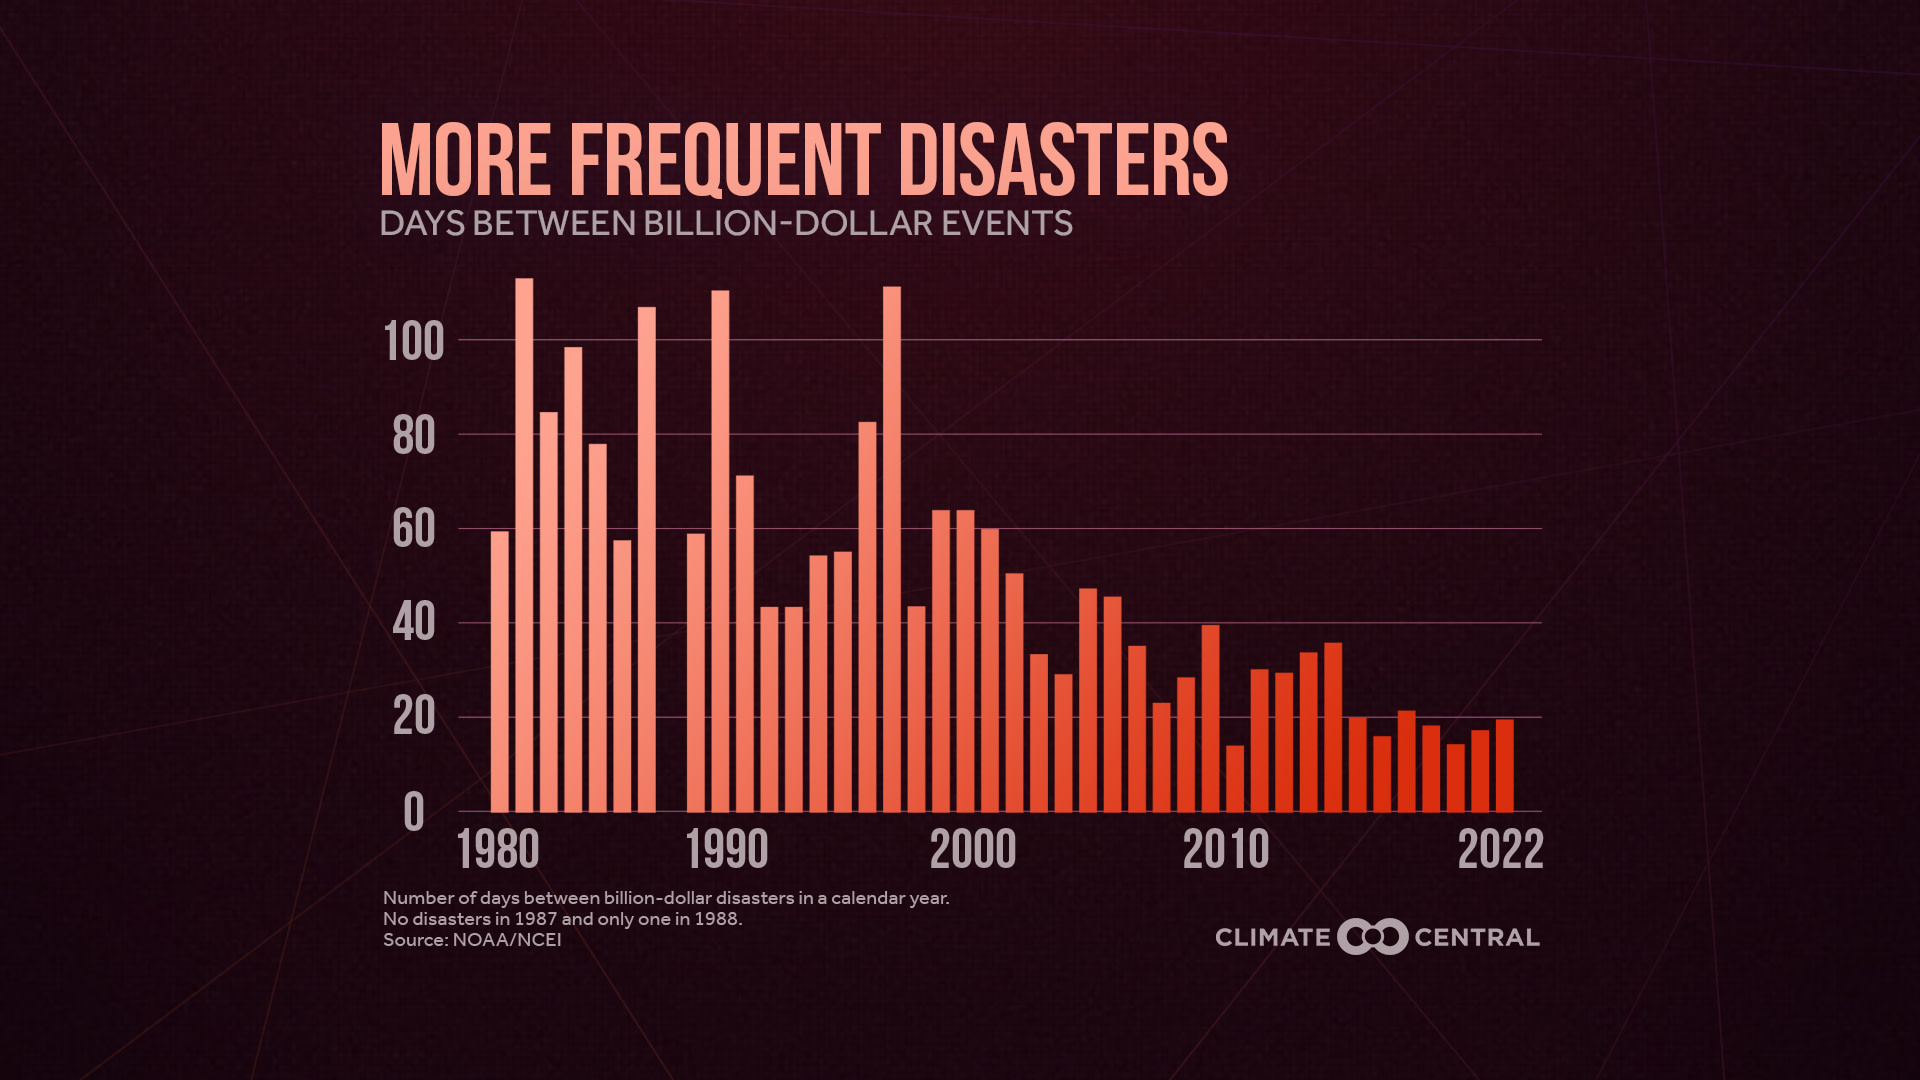
2022 was also a year of disaster fatigue for the U.S., with billion-dollar disasters occurring just 18 days apart in the last five years.
In 2022, 18 billion-dollar weather and climate disasters caused $165 billion in estimated damages.
STAY TUNED: On Thursday, January 12, Climate Matters will cover 2022’s global temperatures.
The U.S. was hit with 18 billion-dollar weather and climate disasters in 2022.
The toll of these events was an estimated 474 lives lost and $165 billion in damages.
The number of billion-dollar disasters in 2022, 2021 (20 events), and 2020 (22 events) was far above the long-term average of 8 billion-dollar disasters per year since 1980.
The average time between billion-dollar disasters dropped from 82 days in the 1980s to just 18 days on average in recent years (2018-2022), straining the resources to respond and recover.
The costly and deadly billion-dollar disasters of 2022 included:
Severe storms were the most frequent billion-dollar disasters in 2022. A total of 10 severe storms between March and July caused nearly $19 billion in damage.
In July, extreme rainfall caused major flooding in Kentucky and Missouri, causing an estimated 42 deaths and $1.2 billion in damage to thousands of homes and businesses.
On September 17-18, Hurricane Fiona brought extreme rainfall, widespread flooding, mudslides, and power outages across Puerto Rico.
On September 28-30, Hurricane Ian caused extensive damage across Florida from high winds, storm surge, and both coastal and inland flooding. The storm caused an estimated 152 fatalities and $112.9 billion in damage—the costliest hurricane on record.
During the 2022 western wildfire season, severe drought and extreme heat sparked and sustained damaging wildfires in New Mexico (including the state’s largest and most destructive wildfire on record), California, Oregon, Washington, Idaho, Montana, and Alaska.
Severe and prolonged drought conditions impacted the West and Southern Plains, contributing to depleted reservoirs, wildfire risk, agricultural losses, and heat-related illness and fatalities in Arizona, Nevada, California, Oregon, and Texas.
2022 was also the 18th hottest year on record for the U.S.
Looking at the top 10 hottest years on record in the U.S., seven have occurred since the year 2000, with the top six years all occurring since 2012.
The annual average temperature for 2022 was 1.4°F above the 20th century average.
2022 had the third-hottest summer in historical record—2.5°F above average.
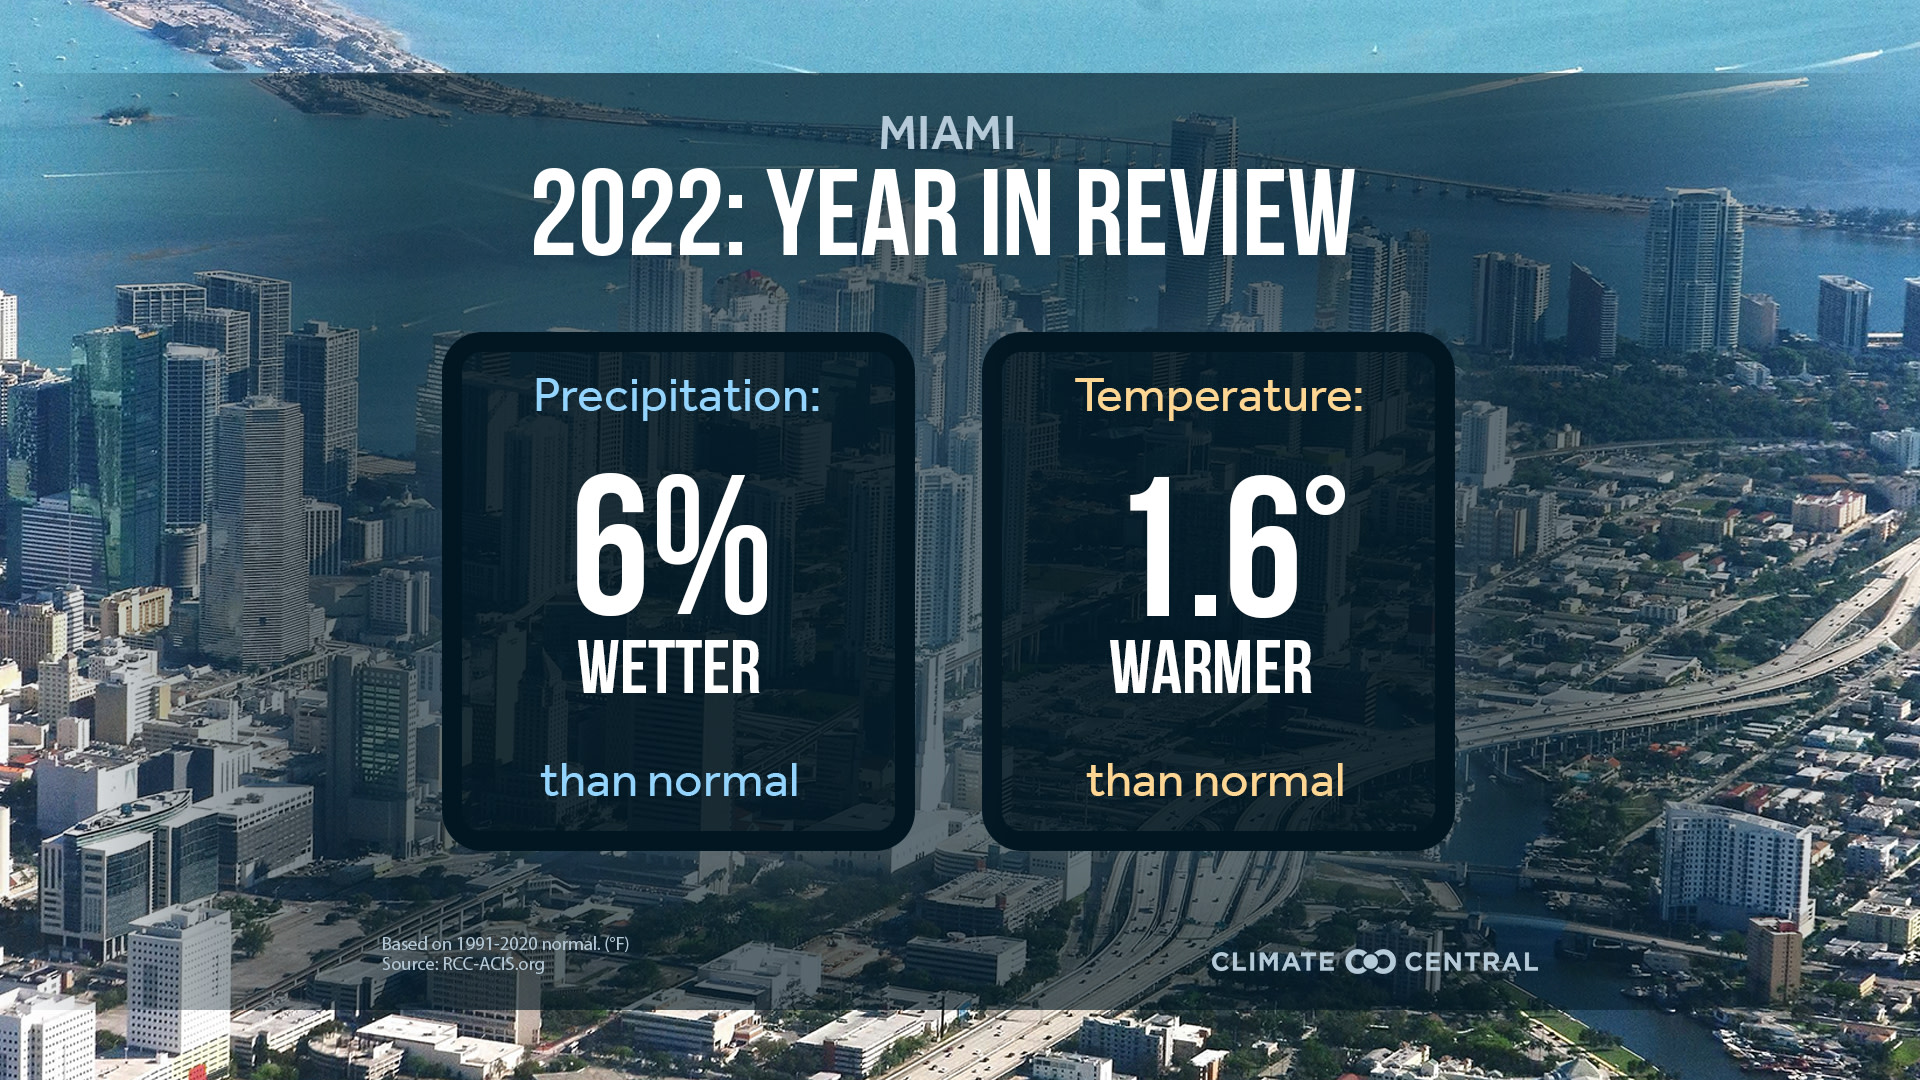
Locally, 2022 was warmer than normal in most U.S. locations.
Of 246 U.S. locations analyzed, 180 (73%) experienced warmer temperatures in 2022 than during the previous 30-year normal period (1991-2020).
Of those 180 locations, 65 experienced 2022 temperatures that were at least 1°F warmer than normal.
Of 246 total locations analyzed, 64 experienced 2022 temperatures that were cooler than normal.
Local drought and deluge in 2022
Local precipitation extremes in 2022 left some parts of the country drenched and flooded, while others were parched and experiencing severe drought.
Of 246 U.S. locations analyzed, 66% were drier than during the 1991-2020 normal period, and 34% were wetter than normal.
2022’s record weather is a snapshot of a longer warming trend.
From 1970 to 2021, average annual temperatures increased in 98% of 246 U.S. locations analyzed.
Two-thirds of those locations have warmed more than 2°F over this period.
Continued heat-trapping emissions lead to the warmer and riskier conditions like those we experienced in 2022. And recent emissions trends are headed in the wrong direction.
Global carbon dioxide (CO2) emissions from fossil fuels are estimated to have increased by 1% in 2022 (relative to 2021), hitting a new record (37.5 billion metric tons) and exceeding 2019’s pre-pandemic levels.
In the U.S., emissions from fossil fuels are estimated to have increased by 1.5% in 2022 relative to 2021—more than the global rate.
If current emissions rates continue, there is a 50% chance that we’ll exceed global warming of 1.5°C (2.7°F) above pre-industrial levels in the next nine years.
Brighter future: there are many opportunities to cut emissions in 2023 and beyond. Every ton of avoided emissions leads to safer conditions for humans and for the infrastructure and ecosystems we depend on.
The latest IEA report charts unprecedented acceleration in renewable energy around the world over the next five years.
In the U.S., the Inflation Reduction Act is providing major incentives for wind and solar energy.
Annual wind and solar PV capacity additions in the U.S. are expected to double by 2027, compared with 2021.
Most of the 50 states have renewable portfolio standards or goals designed to expand low-carbon energy.
LOCAL STORY ANGLES
What weather can we expect at the start of 2023?
NOAA’s one-month to three-month outlooks assess the probability of exceeding thresholds of above and below normal temperature and precipitation in the US. Access January 2023’s temperature, precipitation, and drought outlook for an indication of near-term conditions near you.
Tools for reporting on extreme weather events and disasters near you:
For more information on billion-dollar disasters, check the National Center for Environmental Information (NCEI) site for summary statistics, interactive charts and maps of billion-dollar disasters since 1980, and descriptive information about each event.
FIND EXPERTS
Submit a request to SciLine from the American Association for the Advancement of Science or to the Climate Data Concierge from Columbia University. These free services rapidly connect journalists to relevant scientific experts.
Browse maps of climate experts and services at regional NOAA, USDA, and Department of the Interior offices.
Explore databases such as 500 Women Scientists, BIPOC Climate and Energy Justice PhDs and Diverse Sources to find and amplify diverse expert voices.
Reach out to your State Climate Office or the nearest Land-Grant University to connect with scientists, educators, and extension staff in your local area.
METHODOLOGY
Local anomalies for temperature and precipitation are the differences from the 1991-2020 normal obtained from the Applied Climate Information System. National rankings are from NOAA/NCEI Climate at a Glance.