Climate Matters•September 20, 2021
Climate Change & Crops
KEY CONCEPTS
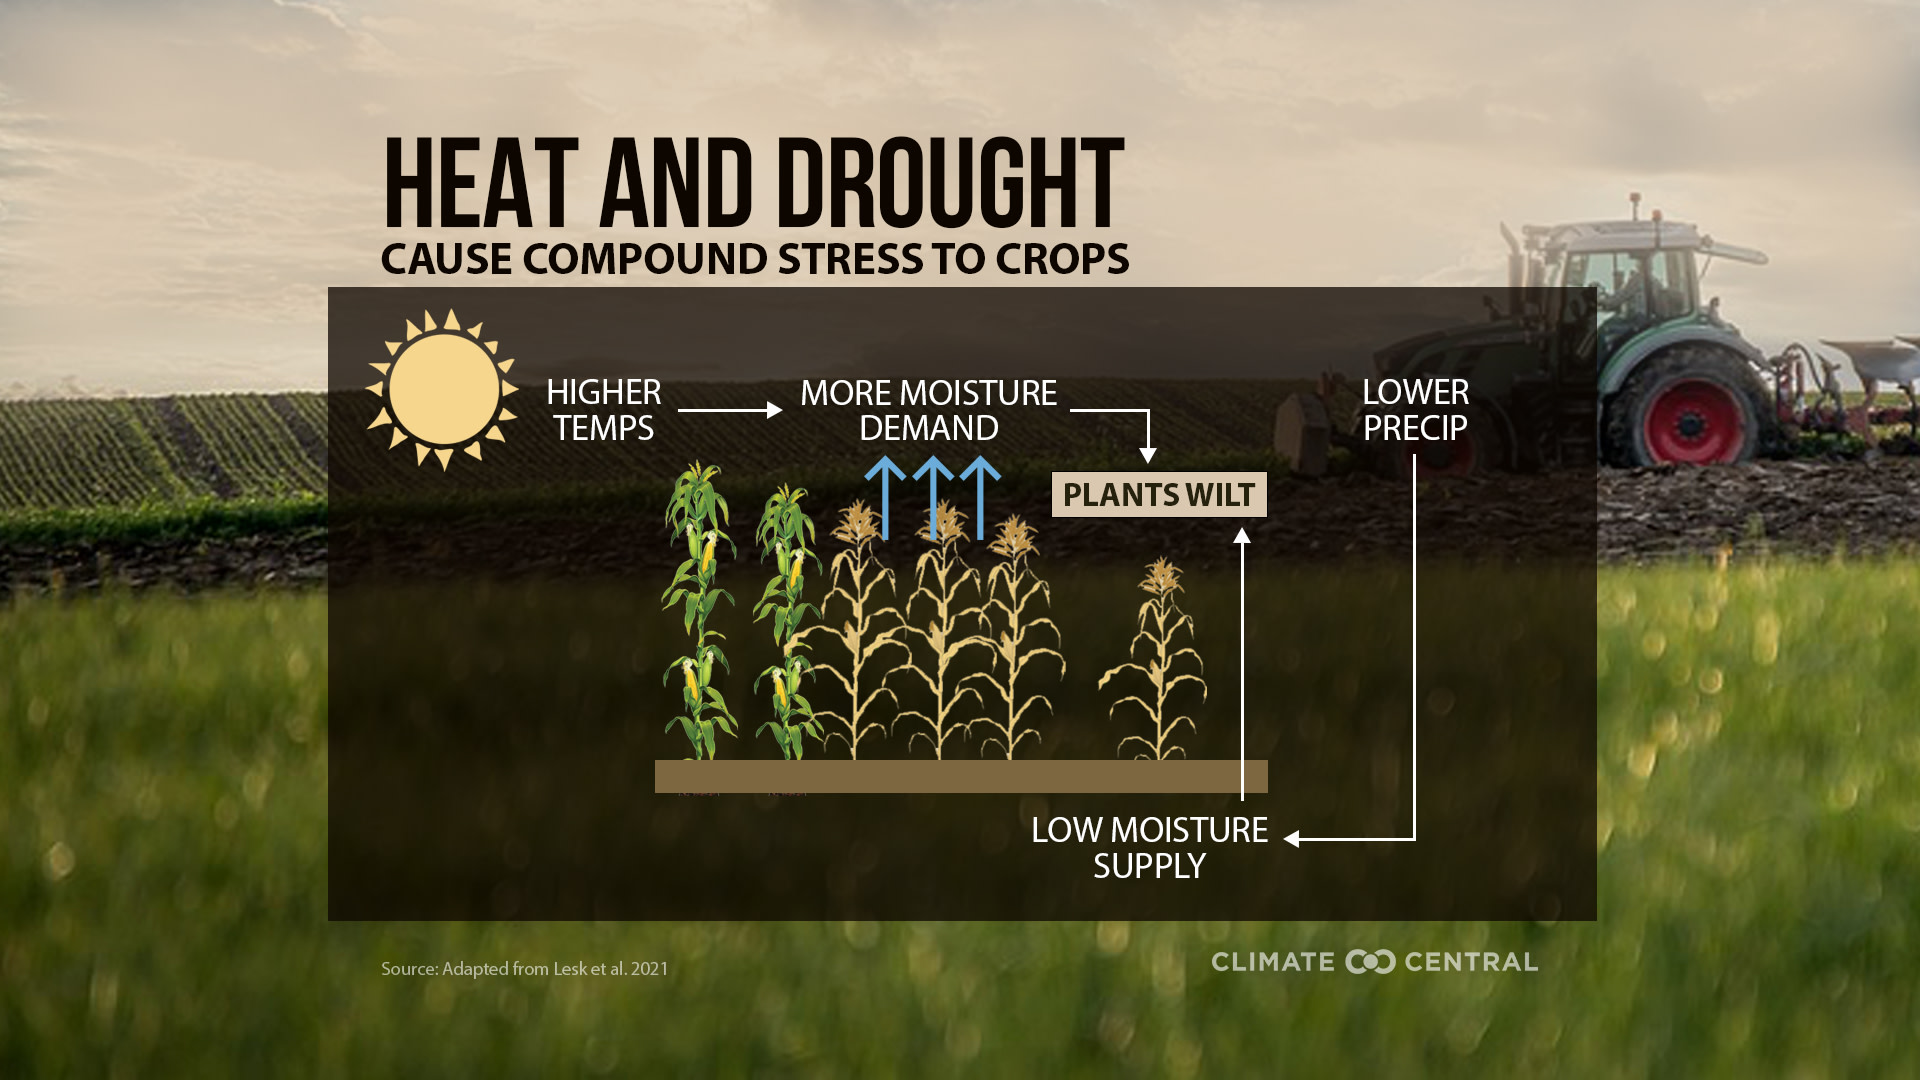
Extreme heat and drought are colliding across large swaths of the United States, damaging crops in the process.
A new study shows that drought exacerbates crop damages from heat, and that drier heat waves from our warming climate may cut global corn and soybean yields by 5% globally.
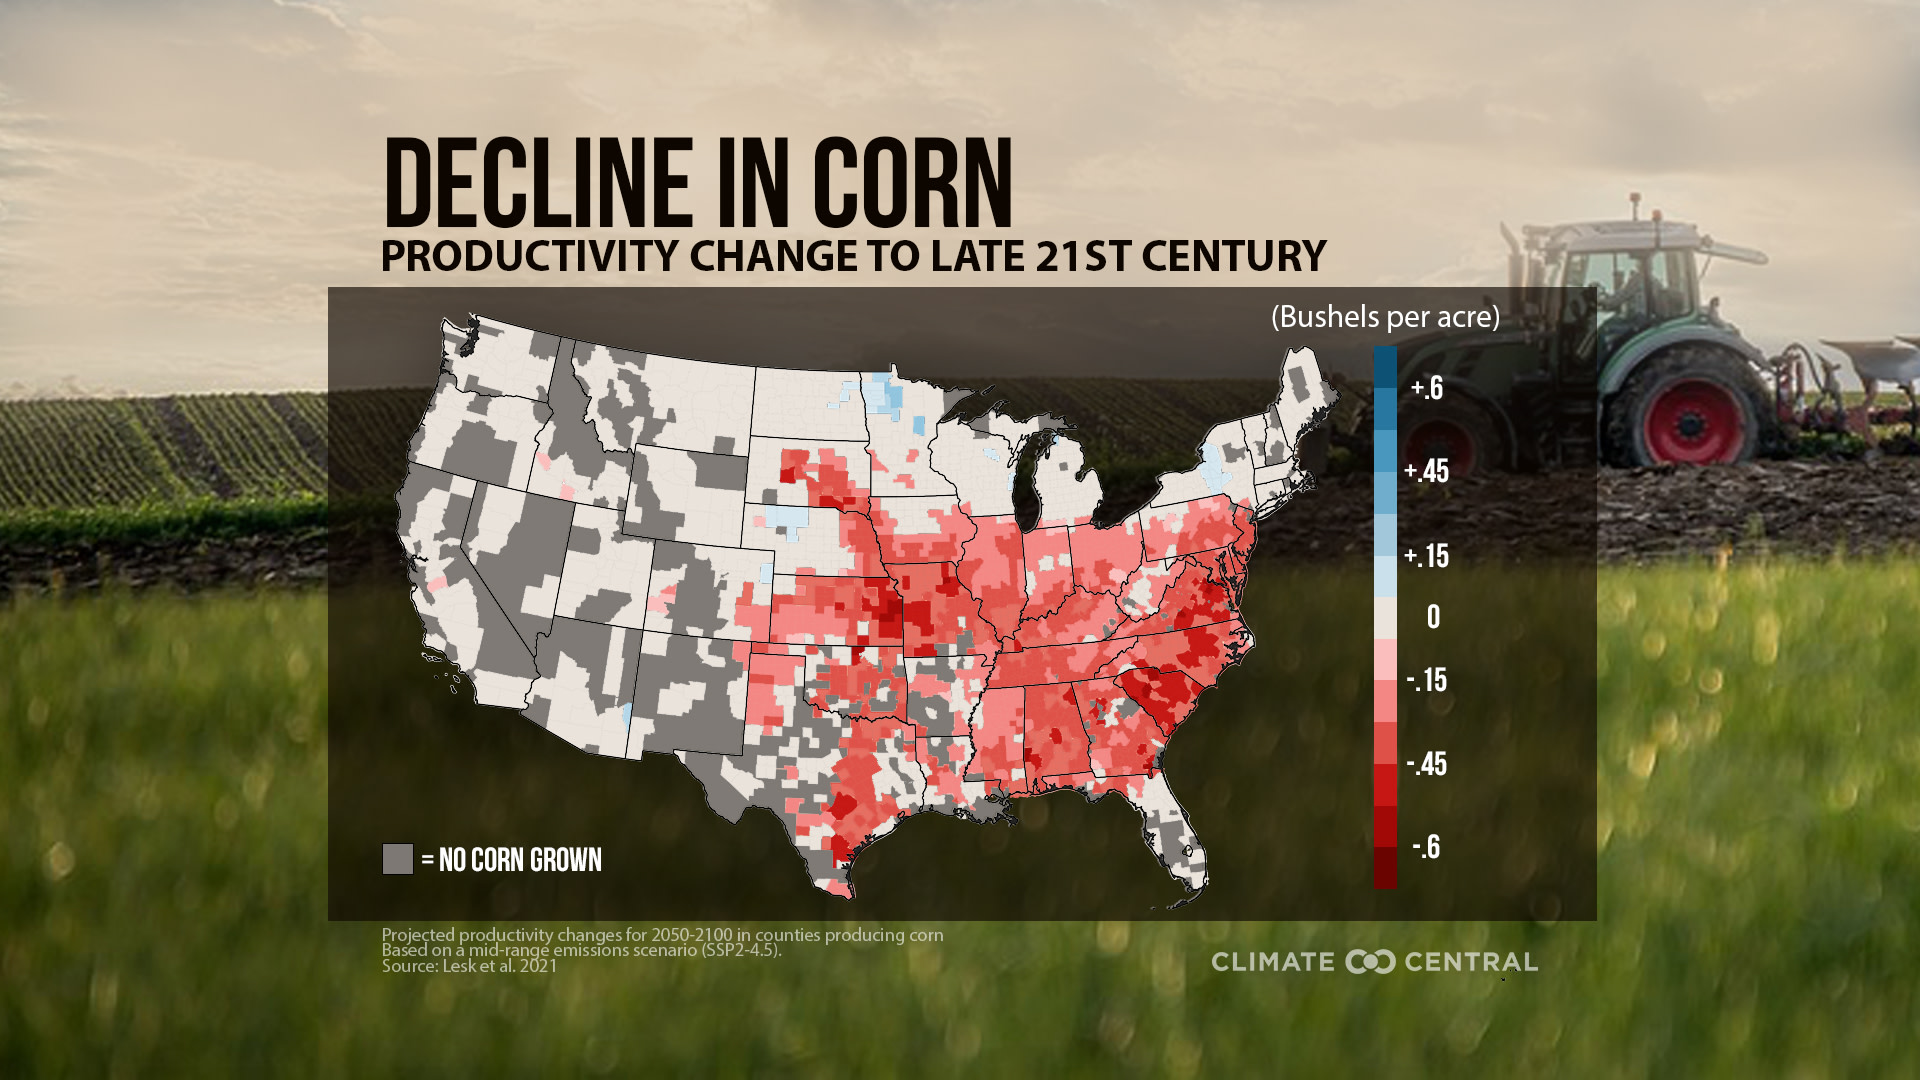
Corn production is expected to fall across much of the U. S., with especially strong declines in Missouri, Kansas, and the Carolinas. Because the harvest is larger in portions of Nebraska, Iowa, and Illinois, the economic impacts are potentially higher in these locations.
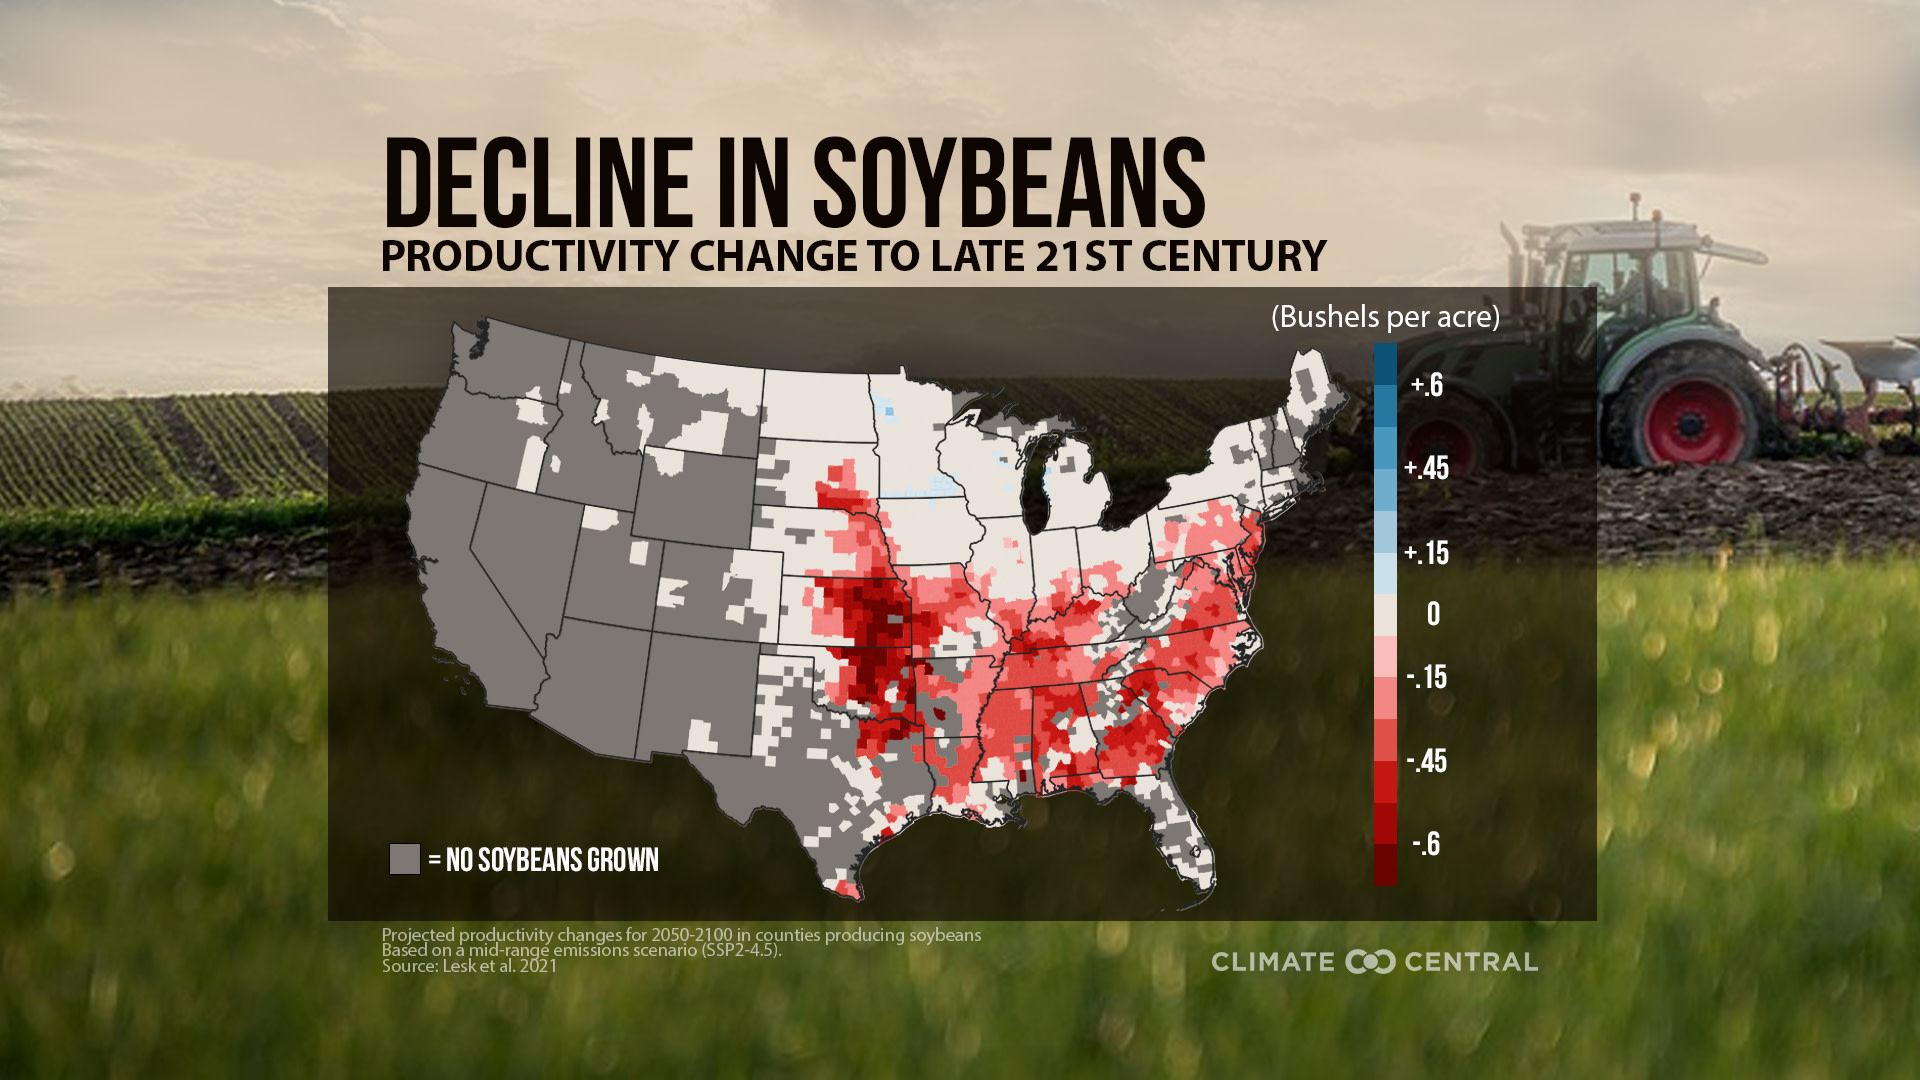
Soy production is also expected to drop, with the largest declines in Oklahoma and Kansas. Compared to recent and historical harvests, the economic impacts are likely to be largest along the Missouri and Mississippi River Valleys.
Record heat, intense drought, and a global pandemic are compounding to put complex pressures on food security worldwide.

The impacts of climate change on agriculture are unfolding in real time. More bouts of extreme heat and drought are threatening growing seasons and the yields of important crops around the world. In recent years, scientists have projected future impacts of the effects of either heat or drought on crops individually. A new study shows that changes in the connections between temperature and moisture after 2050 may bring down yields an additional 5% globally–a trend that threatens farmers’ narrow profit margins.
The scientists looked at two relationships. The first is the relationship between temperature and precipitation. Hotter days are usually sunnier with less cloud cover and rainfall. The second is how temperature is connected to evapotranspiration. Water can evaporate directly from the land surface or indirectly when plants drink water from the soil and release through small pores on their leaves. In many cases, when it gets hotter, the atmosphere gets thirstier, drying out the Earth’s surface.
Historical data showed that in areas where the temperature-moisture relationships are really strong, drought and extreme heat tend to happen at the same time. This makes some crops–like corn and soybeans–more sensitive to heat. From 1970 to 2013, crops in places where drought and extreme heat occured at the same time were up to 40% more sensitive to heat on average, compared to places where drought and heat occurred separately.
Climate models show that in many areas, drought and heat will align more often in the future, worsening crop damages as the climate warms. The researchers estimate that U.S. yields may decline from current averages by 7% for corn and 9% for soybean after 2050.
When you zoom in, areas like the Midwest show the potential for much higher damages than the national average, where drought may exacerbate damages up to 10 to 20%, ranking among the worst places in the world, according to the study. Parts of the Great Plains and Southeast were also identified as hotspots.
This year, record highs were set throughout the U.S. and bouts of extreme weather are only expected to increase in the future. July is also trending hotter in the U.S., the height of the growing season when crops like corn and soy are pollinated. Stressful conditions this year have confronted farmers across the Midwest and Upper Great Plains, especially in North Dakota and Minnesota where soil moisture is extremely low. Farmers are increasingly dealing with multiple weather extremes at the same time.
This summer was a testament to how corn and soy will fare under future hot, dry conditions. The northern Midwest and Upper Great Plains, which were hit hard by drought throughout the summer, saw significant damages to corn and soybean crops. However, other areas fared well.
Of course, this year’s record highs and intense drought aren’t happening in isolation. Farmers were hoping to recover after an especially hard year from the pandemic, but challenging weather this growing season is again raising questions about global food security, especially for marginalized communities. Setbacks from this year’s conditions may have far-reaching consequences.
POTENTIAL LOCAL STORY ANGLES
How do I find out about trends in crops near me?
The USDA tracks agricultural statistics by state and by type of plants and crops.
What can farmers expect in their area in the future?
The Fourth National Climate Assessment has a chapter on agriculture and rural communities, as well as a chapter on land cover and use. Discover future projections on extreme heat using this comprehensive map tool from the Union of Concerned Scientists. And see what climate hazards can be expected locally in the future.
What strategies can farmers use to improve crop harvests?
Make soils more resilient. Retaining soil moisture is key to easing the effects of drought on crop yields. Some farmers adopt a no-till strategy to curb soil erosion. This also leaves the dead plant debris, or residue, on the soil, which can help sequester carbon, protect the soil in the winter, and keep it cooler and wetter in the spring. Strip-till is a combination of no-till and full till, where farmers till part of the soil. Regenerative agriculture is also gaining traction as well as growing environmentally friendly crops, like kernza, with deep roots that don’t need to be planted every year. Planting dates and irrigation schedules can also be tailored based on seasonal weather forecasts. Experimenting with new and more diverse drought- and heat-resistant varieties may also make crops more resilient to compound weather stresses.
LOCAL EXPERTS
SciLine, 500 Women Scientists, 500 Queer Scientists, Diverse Sources or the press offices of local universities may be able to connect you to local experts who can discuss the impact of climate change on agriculture. The National Integrated Drought Information System, or NIDIS, can also provide information on drought monitoring and forecasting at national, tribal, state and local levels.
NATIONAL EXPERTS
Corey Lesk
Lead author of “Stronger temperature–moisture couplings exacerbate the impact of climate warming on global crop yields“ in Nature Food and graduate student at Lamont
Doherty Earth Observatory, Columbia University Earth Institute
Research interests include how extreme weather affects agricultural and natural ecosystems around the world.
lesk@ldeo.columbia.eduJonathan Winter, Ph.D.
Associate Professor of Geography, Dartmouth University
Research interests include climate impacts on water availability and agriculture as well as the causes and predictability of climate extremes
jonathan.m.winter@dartmouth.eduMolly Woloszyn, Ph.D.
Midwest Regional Drought Information Coordinator for NOAA's National Integrated Drought Information System (NIDIS)
molly.woloszyn@noaa.govDennis Todey, Ph.D.
Director, USDA Midwest Climate Hub
dennis.todey@ars.usda.govNational Farmers Union
Media Contact: David Schuller
dschuller@nfudc.orgLayla Soberanis, Senior Government Relations Representative
Available for interviews in Spanish and English
lsoberanis@nfudc.org
ADDITIONAL VIDEO RESOURCE
Food & Farming in a Warming World, a webinar recorded September 15, presented by the Society of Environmental Journalists.
METHODOLOGY
The researchers in Lesk et al. (2021) analyzed historical temperature and precipitation data from 1961- 2010 from the Hadley Center Climate Research Unit and evapotranspiration data from the Global Land Data Assimilation System. The team used a regional crop yield dataset for 1970 to 2013, focusing on corn, wheat, rice and soy. To project future changes, they used the newest sets of model simulations from the recently-released sixth assessment report from the Intergovernmental Panel on Climate Change (IPCC). They modeled the time period from 2051 to 2100.
Climate Central mapped the projected change in corn and soy production (bushels per acre) for counties that produce these crops. We then multiplied the production by the value of the harvest in these counties to calculate the potential economic impact of the projected changes in production. Production and value were obtained from the most recent USDA Agriculture Census (https://quickstats.nass.usda.gov).
The stories below are served through a new pilot program from our partners at the Solutions Journalism Network, and were not created by or with Climate Central.